Zuora Analytics Release Notes
This page is no longer maintained. Please visit Zuora Release Notes for the latest release notes.
May 19, 2021
For a very small percentage of customers, data refreshes were not running as expected starting Thursday May 13, 2021 at 4pm Pacific Time. This issue has now been resolved.
May 1, 2021
We have released the following new features and changes in Zuora Analytics.
-
When creating or editing a table card, you can now select all or none of the fields listed in the field selector:
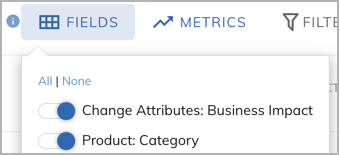
This change enables you to configure the fields using fewer clicks.
For information about creating and editing table cards, see Create a table card.
-
When you hover over a chart on the dashboard, Zuora now displays the full amount for each monetary value:
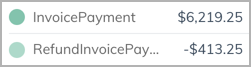
Previously, Zuora displayed abbreviated amounts such as $6.2k. This change enables you to more easily compare monetary values between different groups.
April 30, 2021
Zuora Analytics now includes eight datasets as standard. You cannot edit or delete the standard datasets. The standard datasets do not count towards the dataset usage of your Zuora tenant.
The standard datasets are:
- Active Subscriber Count (Monthly)
- Average Net MRR per Subscriber (Monthly)
- Billing Activity (Monthly)
- Churned Subscriber Count (Monthly)
- Net MRR (Monthly)
- Net MRR Changes (Monthly)
- New Subscriber Count (Monthly)
- Payment Activity (Monthly)
Previously, these eight datasets were the default datasets in Zuora Analytics. However, it was possible to edit and delete the datasets. Zuora has ensured that your tenant now includes all eight datasets, even if some of the datasets had previously been edited or deleted. If you had previously edited one of the datasets, your modified dataset now has "(mod)" in the name.
For more information about the standard datasets, see Default Dashboard layout, cards, and datasets.
In addition to using the standard datasets in cards, the standard datasets can be a starting point for your own custom datasets. To create a custom dataset based on a standard dataset, locate the standard dataset then select Clone from the dataset menu ( ).
).
Custom datasets count towards the dataset usage of your Zuora tenant. For more information, see Zuora Analytics governor limits.
For more information about creating and editing custom datasets, see Create or edit a dataset.
November 17, 2020
We have released the following new features and changes in Zuora Analytics.
- Each tenant can now have up to five dashboards. Administrators can select the default dashboard for the tenant. Each standard user can select the default dashboard for themselves.
You can manage dashboards (including setting the default dashboard for yourself or for your tenant) in Explorer > Dashboards. For details, see Using the Dashboard. - We introduced the logic for determining whether a dataset change would invalidate downstream cards. For changes that do not invalidate downstream cards, we do not ask users to confirm the deletion of downstream cards. Previously, any change to a dataset would invalidate existing downstream cards. For details, see Create or edit a dataset.
- On January 31st 2021, all legacy cards in Zuora Analytics will be retired and removed. If you are currently using legacy cards that you wish to keep after that date, you will need to move those cards to datasets before that time. To learn about how to convert legacy cards to dataset-based cards, see Legacy Cards Retirement Guide.
Legacy cards are cards that are not based on datasets. These cards were released with the original version of the Zuora Dashboard feature.
September 29, 2020
Zuora released the following new features and enhancements in Analytics.
- In Timeseries cards, we added a new Settings button to give you the option to combine all groupings (applicable when using the Group by option) from rank 11 onwards into a single category labeled ‘Other’. This option provides additional insight into how the top 10 categories compare with the rest of the data in your Zuora tenant.
- In the dataset editor, we added a panel to display a brief description of the metric that is being selected on the drop-down list.
- In the dataset editor, we added relative date filters so that you can now filter data by date dimensions relative to the current date. For example, now you can create these types of data:
- Subscriptions created in the last 30 days,
- Rate plan charges effective in the past 30 days
- Subscriptions that will be canceled in the coming 3 months
- In the dataset editor, we added the ‘Payment’ object with a join relationship to the Net Payments objects. The following Payment fields are exposed:
- Payment - Accounting Code
- Payment - Gateway
- Payment - ID
- Payment - Payment Number
- Payment - Reference iD
- Payment - Source
-
User can now freeze and unfreeze a given set of columns to the left or right side of a table card, or the “group-by” column in a time series card.
August 31, 2020
Zuora just released an update in Analytics to set the default currency of the tenant as the metric currency in the default datasets and cards that have not been edited by users. Previously, USD was the metric currency for all default datasets and cards.
August 18, 2020 - Zuora Analytics is generally available
Zuora Analytics is now generally available to all Zuora customers. You can find Analytics in the left navigation panel of Zuora.
Zuora Analytics provides a pre-computed library of essential subscription metrics that helps users of Zuora track the health of their business, make business decisions informed by data, and ultimately uncover and drive new revenue opportunities. Metric computations are based on best practices from Zuora’s Subscribed Institute think tank.
Analytics consists of five key components:
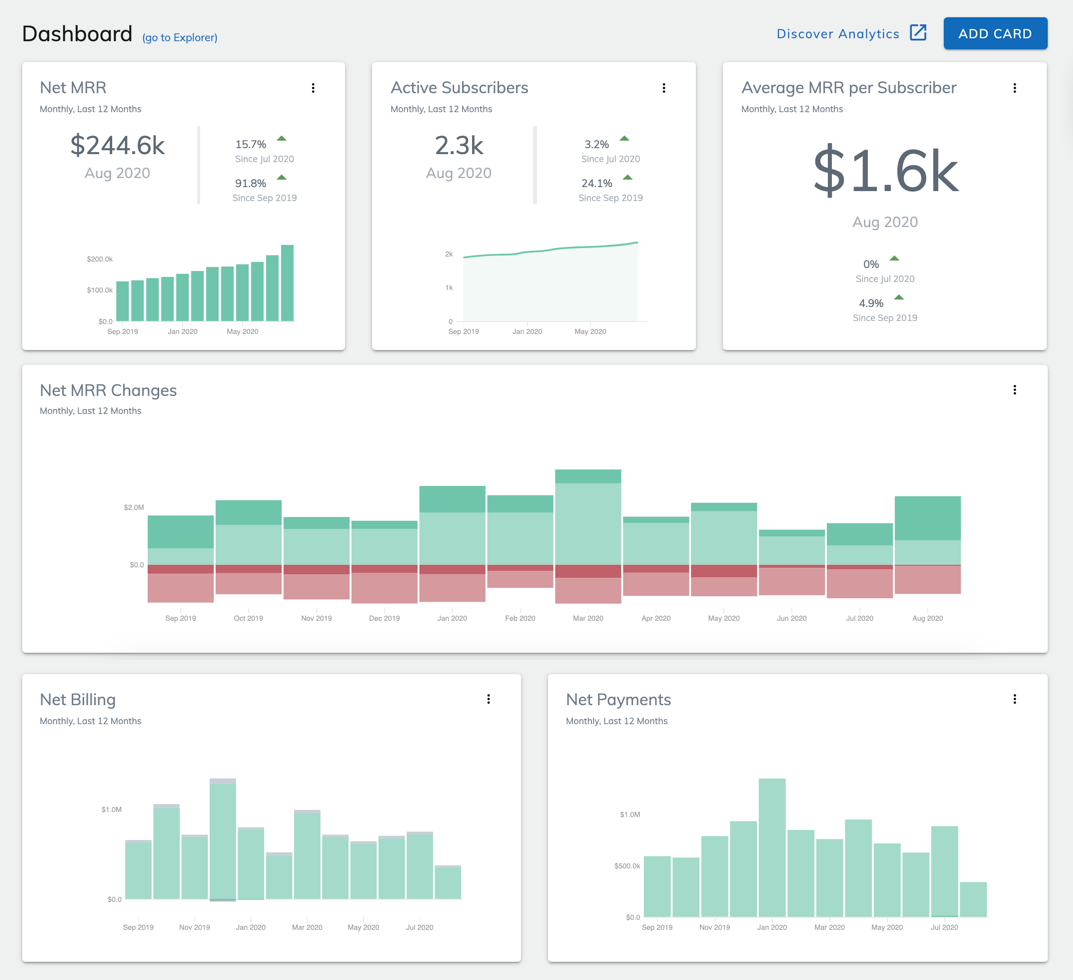
- Dashboard: The Dashboard provides a birds-eye view of your business. For details, see Using the Dashboard.
- Explorer: In Explorer, you have access to all of the analysis you’ve created in Analytics, including the cards you’ve added to your Dashboard, as well as all of your datasets. For details, see Using the Explorer.
- Cards: You use cards to visualize the data in your datasets. There are two types of cards in Analytics:
- Time series cards: These cards help you visualize trends in metrics over the time period you defined in a given dataset. See Create a time series card for details.
- Table cards: You can use these cards to present your data in an interactive table grid. See Create a table card for details.
- Datasets: Datasets are the data tables behind every card in Analytics; as such, they are the foundation of all data analysis in Analytics. For details, see Create a dataset.
- Metrics: Metrics are key performance measures that help you track the health of your business over time. For details about the metrics available in Analytics, see Analytics metric glossary.
For information about how to get started, see Getting started with Analytics.