Using the dashboard
In Zuora Analytics, a dashboard displays key subscription metrics as interactive cards. You can view and interactively analyze data that is shown in various cards in a dashboard. You can perform various actions to customize the layout of a dashboard.
Five dashboards are allowed in each tenant. Administrators can configure the default dashboard for the tenant. Each standard user can configure the default dashboard for themselves.
View a dashboard
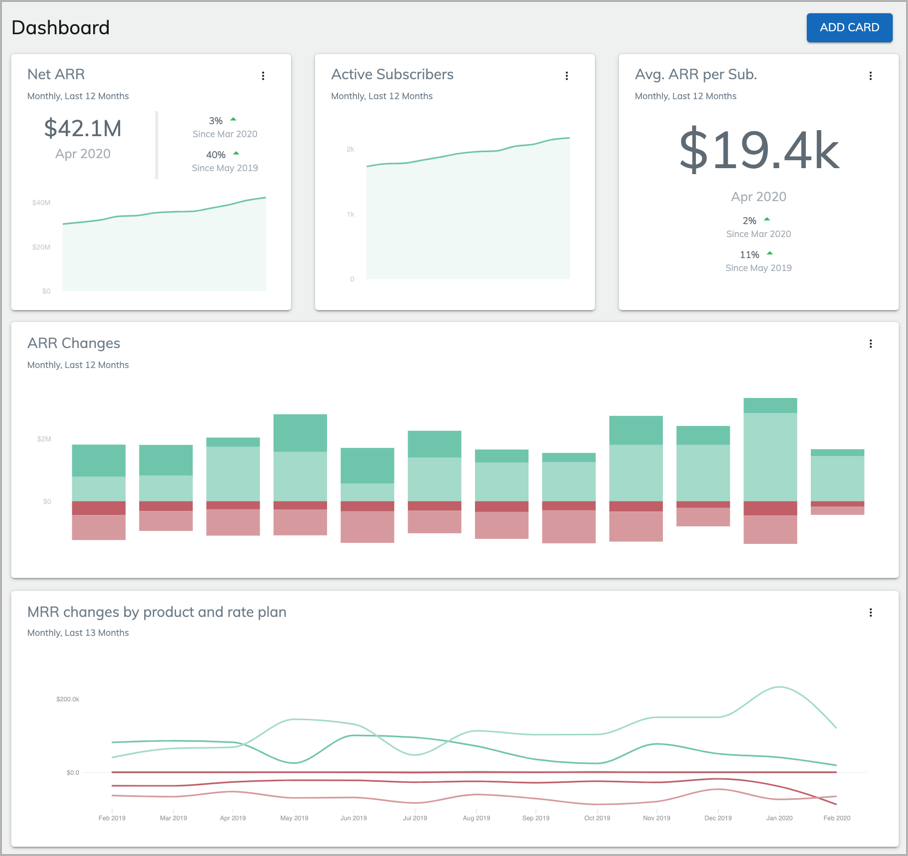
To view the default dashboard, navigate to Analytics > Dashboard in your Zuora tenant. The dashboard opens and displays key subscription metrics as cards.
To view and manage all dashboards on your tenant, navigate to Analytics > Explorer, and then select the Dashboards tab.
-
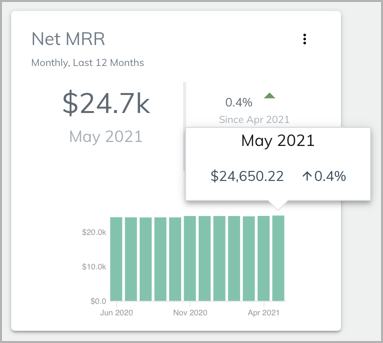
View the metrics shown in different cards. Hover over a chart to display a summary of data for any period, including the metric value and period-over-period rate of change.
-
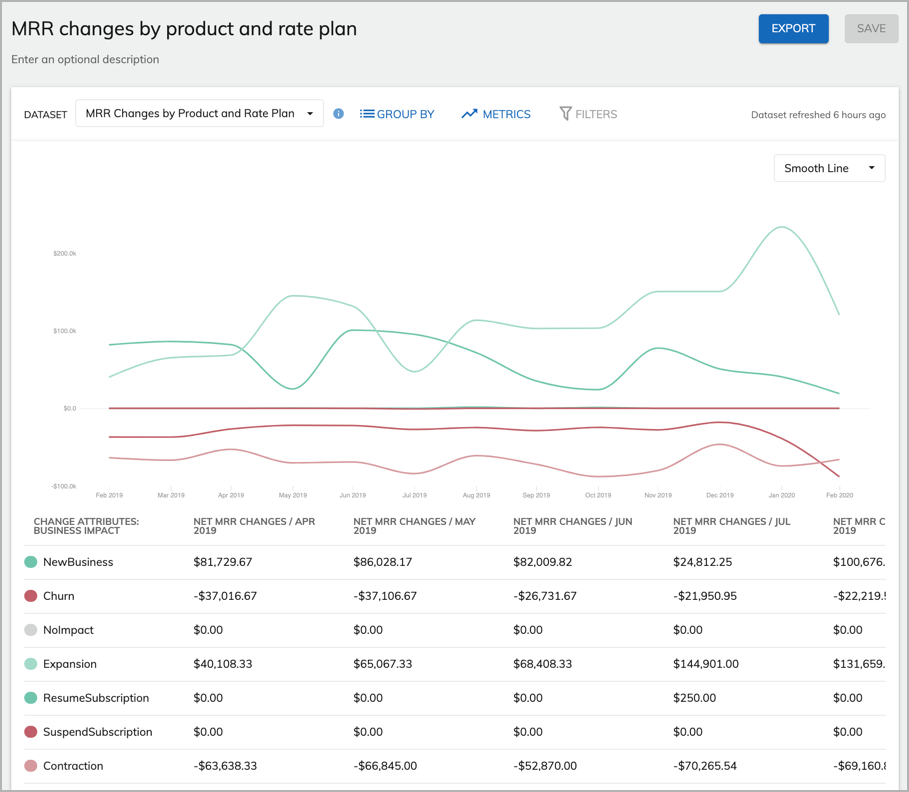
To view detailed data in a card, click on the card.
The card details page displays.
-
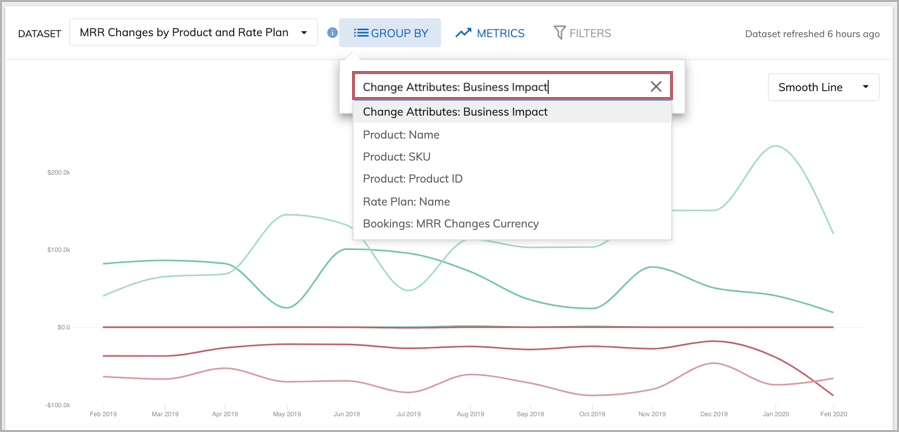
For a time series card, to change the attribute that data is grouped by, click Group By and click on the attribute text field. Then you can select any attribute that is available in the card.
-
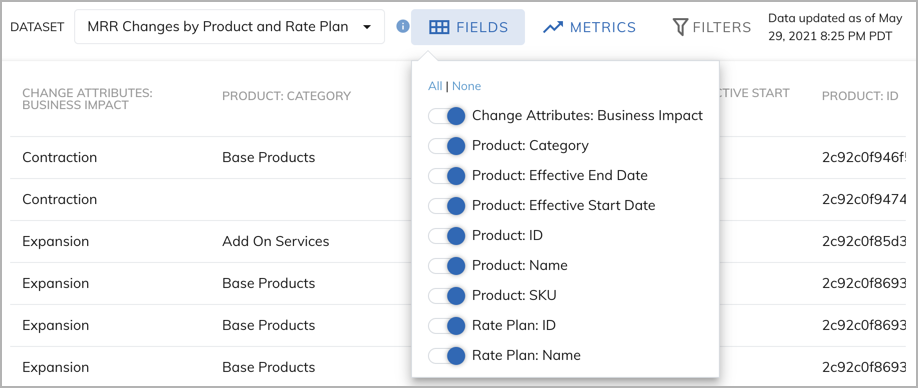
For a table card, to configure the fields that are used to sort the data, click Fields. Then you can select and deselect fields. When you deselect fields, Analytics will automatically aggregate data.
-
If you want to export the data in the card for additional analysis, click Export on the top-right of the page.
Customize the layout of a dashboard
Only users with the ‘Manage Analytics’ user permissions can organize cards in the Dashboard, create or edit cards or datasets in the Explorer. To learn about how to get the user permissions, see Analytics roles.
Layout edits are immediately visible to other users. All users in your Zuora tenant see the same Dashboard.
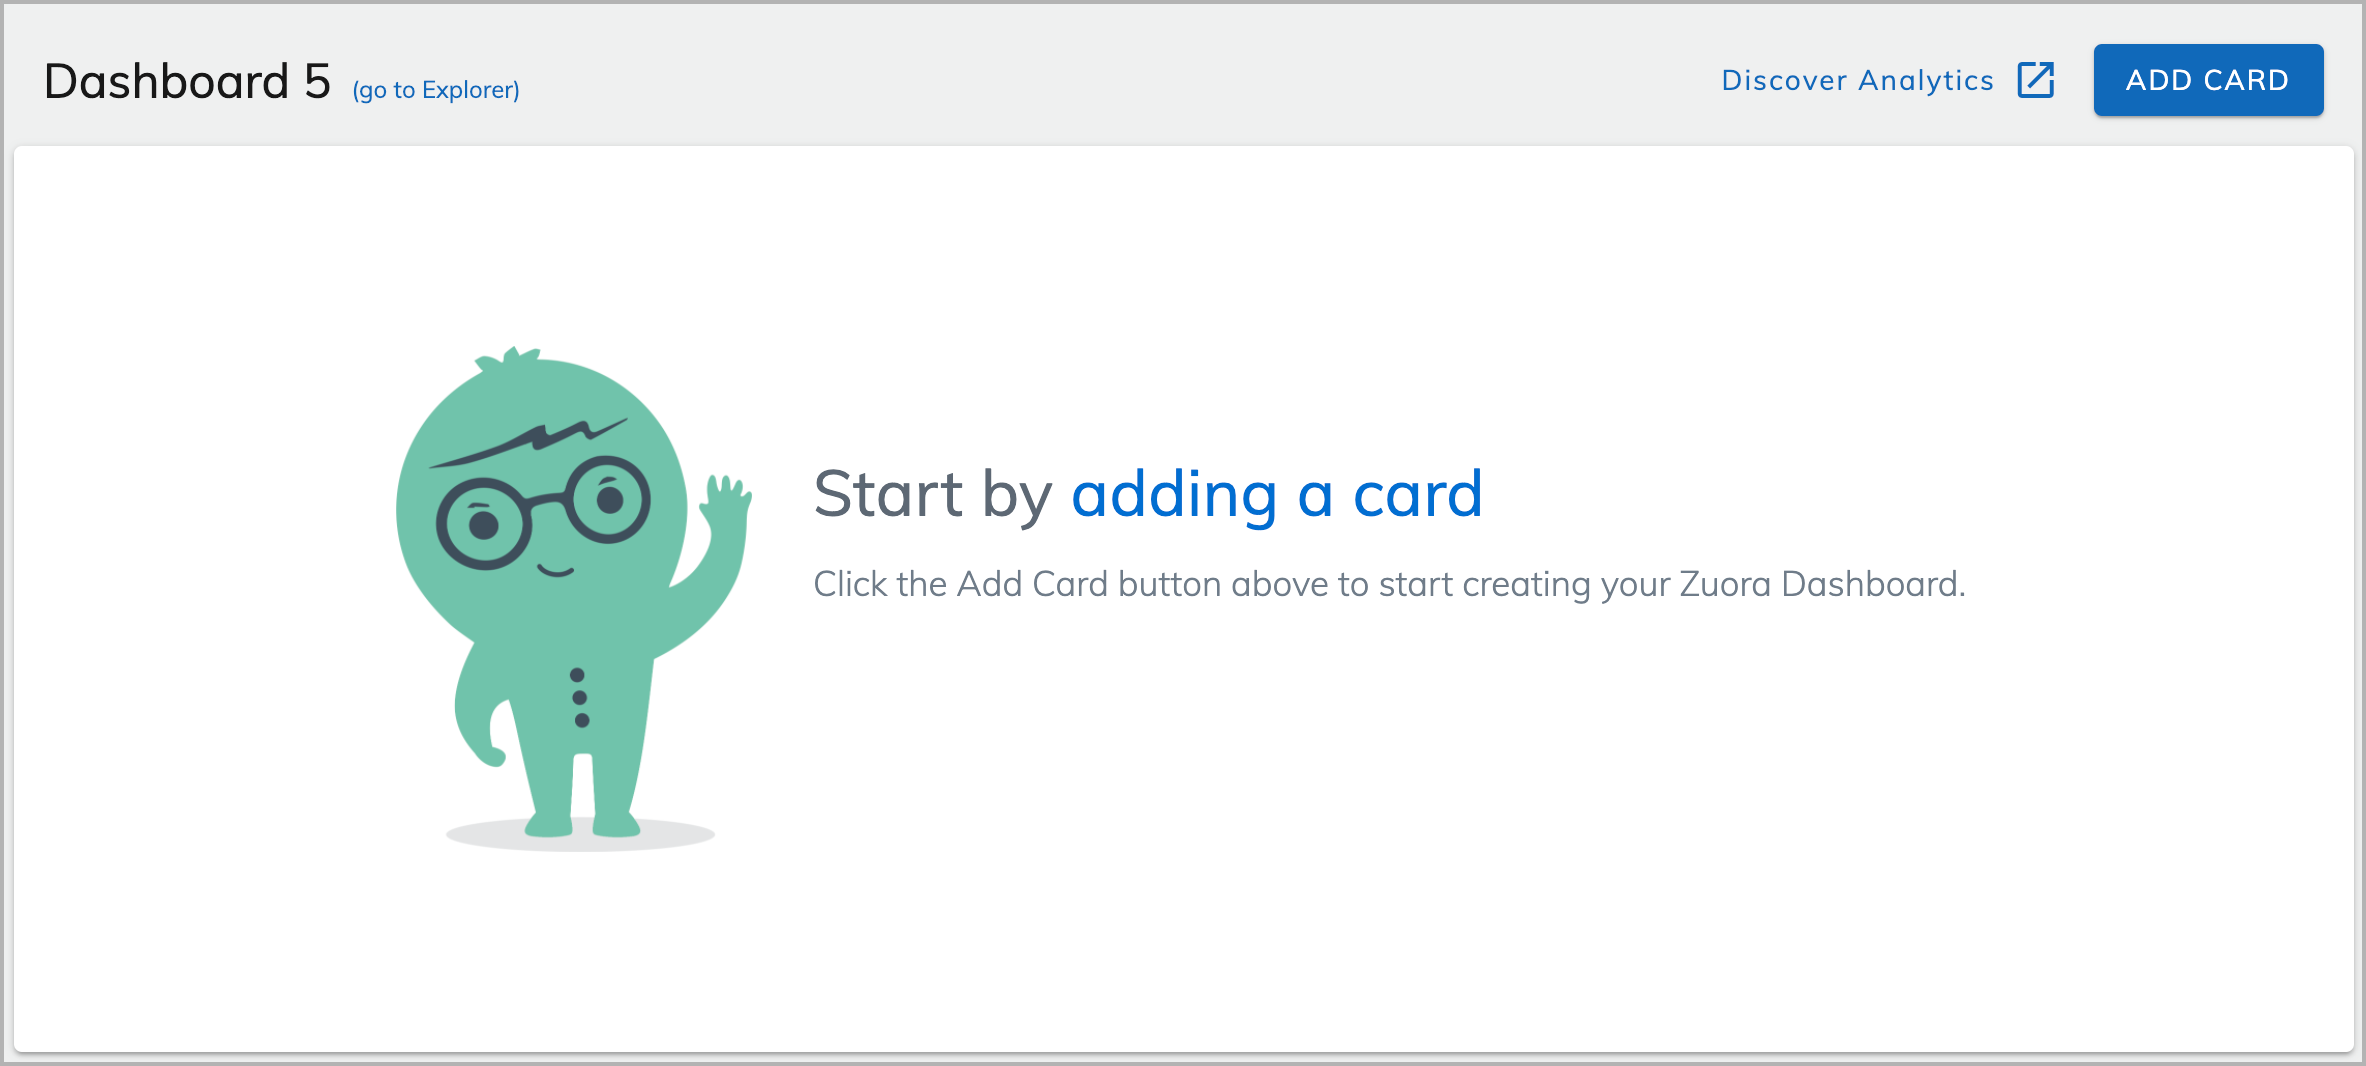
Add a card
To add a card, click the Add Card button in the upper right corner of the dashboard.
You can add two types of cards, table cards and timeseries cards.
New cards are added to the bottom of the Dashboard and are visible to all users with access to Analytics. To learn more about the differences between table cards and timeseries cards, see Using cards.
Clone a card
To clone a card, click the menu icon at the top-right of the card and choose Clone.
.png?revision=1)
Clones are added to the bottom row of the Dashboard and are instantly visible to all users of Analytics.
Delete a card
To delete a card, click the menu icon at the top-right of the card and choose Delete. When you delete a card, the card is entirely deleted from Analytics, including in the Explorer. If you only want to remove a card from the Dashboard, but keep it in the Explorer, select Unpin in the card menu.
Move a card
To move a card, drag the card to the desired location. When you move the card, the dashboard changes for all Zuora users in your organization.
Resize a card
To resize a card:
-
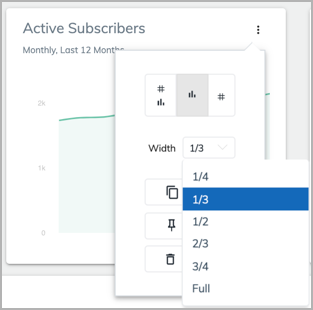
Click the menu icon at the top-right of the card.
-
From the Width drop-down list, select the new width of the card.
When you resize the card, the Dashboard changes for all Zuora users in your organization.
Change card display options
This action is not available for ARR Changes or MRR Changes.
To change how a card is displayed:
-
Click the menu icon at the top-right of the card.
-
Select a display option:
Show headline numbers and a chart Show a chart only Show headline numbers only
When you change the card display options, the dashboard changes for all Zuora users in your organization.
Headline numbers are not available for Timeseries cards that have a Group By enabled.
Manage your dashboards
Each tenant can have at most five dashboards. You can add new dashboards, and edit, clone or delete existing dashboards. You can set a dashboard as the dashboard for yourself or for the whole tenant. The default dashboard is the dashboard that will display when you click Dashboard in the left navigation panel.
To manage your dashboards, navigate to Analytics > Explorer, and select the Dashboards tab. All your dashboards are displayed in this tab.
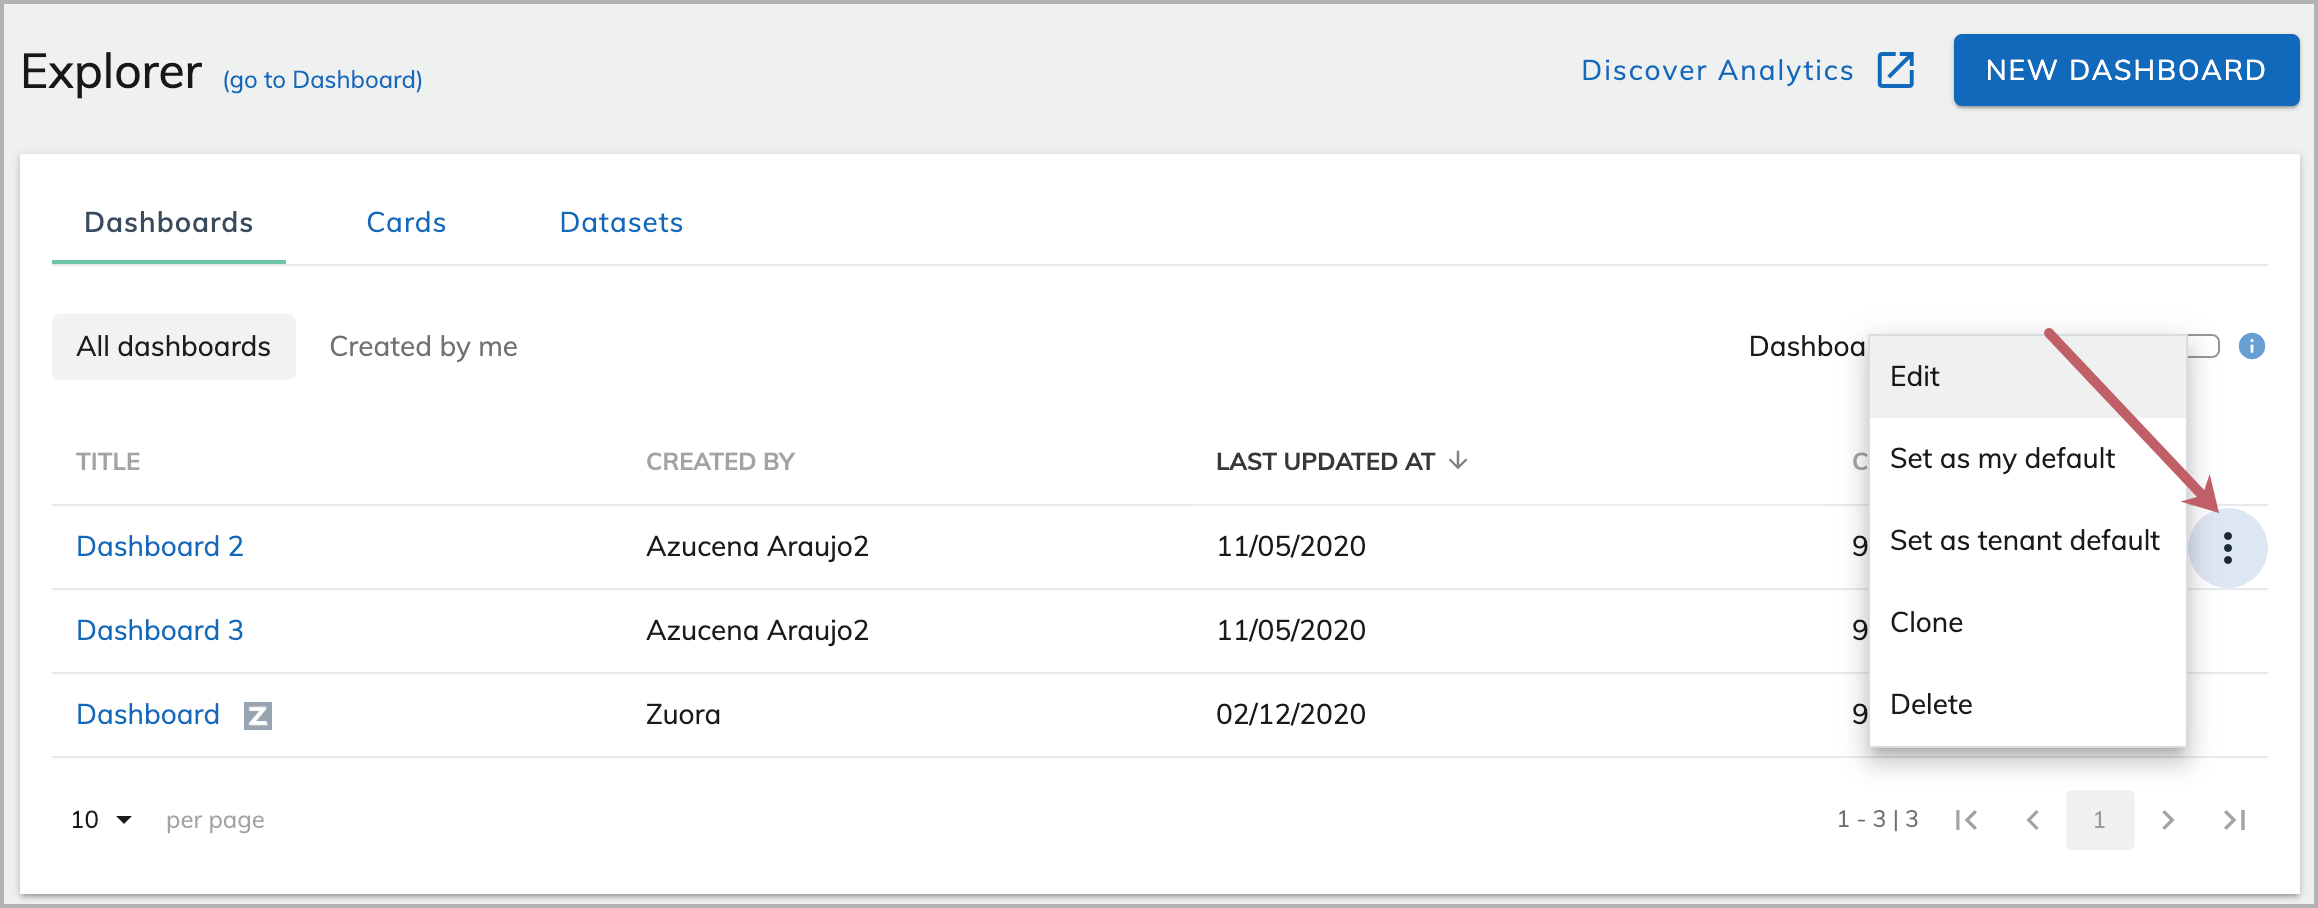
Click the menu icon to view the actions you can perform to the dashboard.
- Edit: Edits the title of the dashboard.
- Set as my default: Sets the dashboard as the default dashboard for yourself. The default dashboard has a sign to the right of its title.
- Set as tenant default: Sets the dashboard as the default dashboard for the tenant. This dashboard will become the new default dashboard for all users on the tenant.
- Clone: Creates a replica of the dashboard.
- Delete: Deletes the dashboard.
Create a new dashboard
You can create a new dashboard to contain a different set of cards.
To create a new dashboard:
Navigate to Analytics > Explorer > Dashboards, and click New Dashboard on the top right of the page.
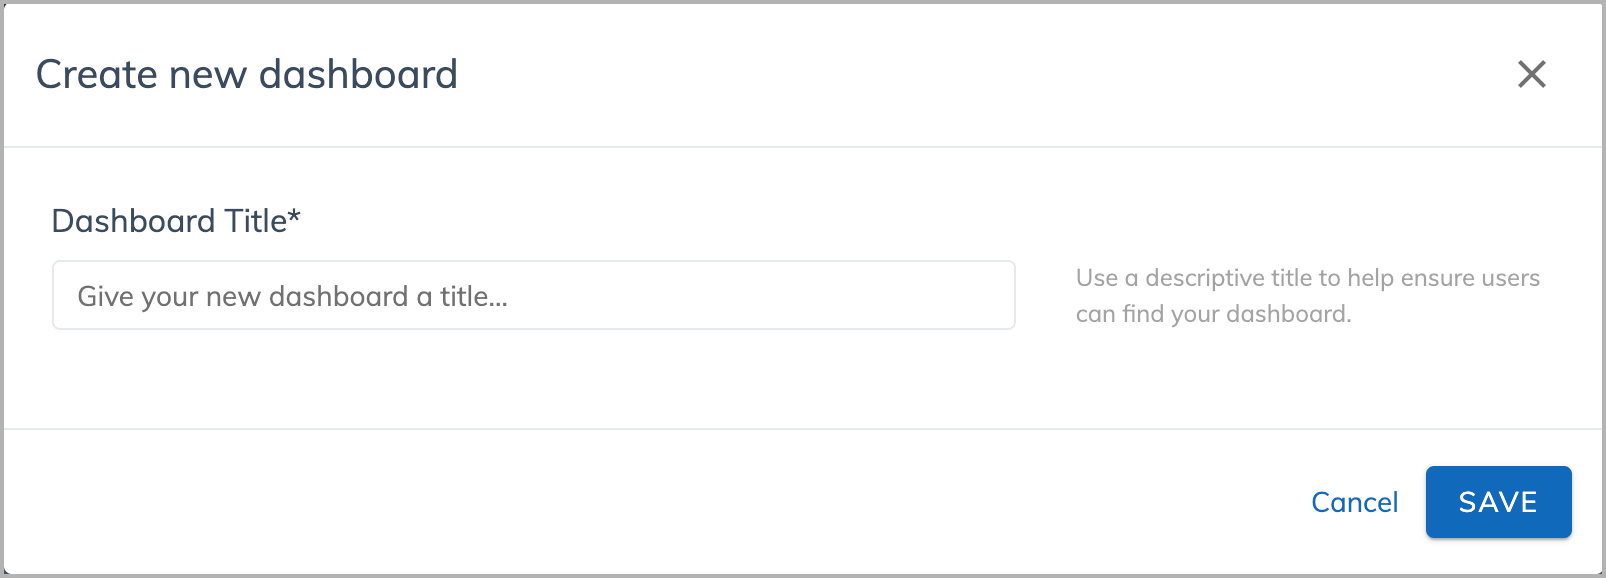
Specify a name for the dashboard, and click Save.
You can create a new card and add it to this dashboard.
To add a new card, click Add Card on the top right. Complete necessary configurations for the card, and click Save to save the card and add it to the dashboard. Repeat this step if you need to add more new cards to the dashboard.
If you want to pin existing cards to the dashboard, follow the instructions described in Pin a card to a dashboard.