Community Performance Data
You can use the Community Trends section see to what your registered users are doing. Registered users have signed up on your site, but have not taken a subscription. The Community Trends information represents the end user journeys defined in the Registered section of your feature rules.
The metrics displayed in the Commercial Trends section cover the following information:
- A summary of your total registered users
Note: The total number of registered users might also include customers. This number represents anyone who has an account that is stored in Zephr.
- Users registered over time
This shows the number of end users who register on your site each day.
The New Registrations graph shows how many end users registered on your site each day, and the growth rate, as illustrated below:
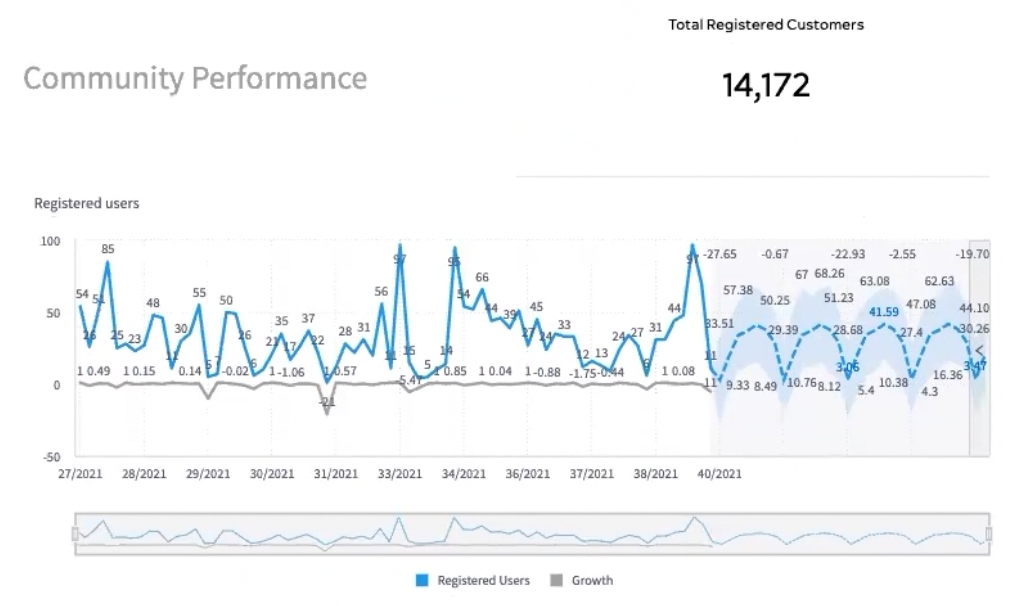
Data shown as a dotted line provides a forecast for the next 30 days. The forecast is based on the current growth in registrations and assumes that you have not changed anything in your set up, such as changes to rules or starting a new campaign. If you hover over this area, you can see the following information based on your data and the date that the forecast covers:
- Forecast value
The forecast value shows the forecasted number of registrations for the forecast period based on your current data.
- Upper bound
The upper bound shows the highest number of registrations that you can expect during the forecast period based on your current data.
- Lower bound
The lower bound shows the lowest number of registrations that you can expect during the forecast period based on your current data.
- Confidence level
The confidence level is based on your data and the forecast period.
- Forecast value