View and Understand Analytics Data
If you use an HTML or SDK implementation, you can view in-rule analytics data for your features.
View analytics data
To view your analytics data, complete the following steps:
- Select Products from the main menu
- Select Features from the menu options
- Select the feature for which you want to view analytics data
- Select the version of the feature you require
Notes:
- If you create – or update – a feature, it must be published before any analytics data can be gathered and displayed
- If you have previous versions of your feature rule, which contained analytics data, you can review the data for that version by selecting it from the Version column
- If a version of the feature rule was created before Zephr Journey was enabled, and it has not been live since it was enabled, no analytics data will have been collected for that version
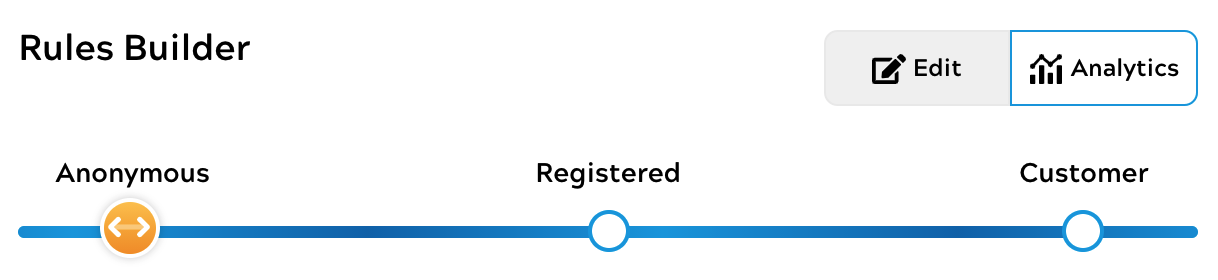
- Scroll down to the Rules Builder section
- Select the Analytics button, as illustrated below:
Note: Zephr recommends that you view this data in full-screen mode. To open the rules builder in full-screen mode, select the Full-screen icon at the bottom right of the rules canvas.
-
You can filter the data by data using the data filter at the top right of the canvas. When a filter is applied, the same date range is applied to your export data. For further information on exporting data, see the Export the Data section.
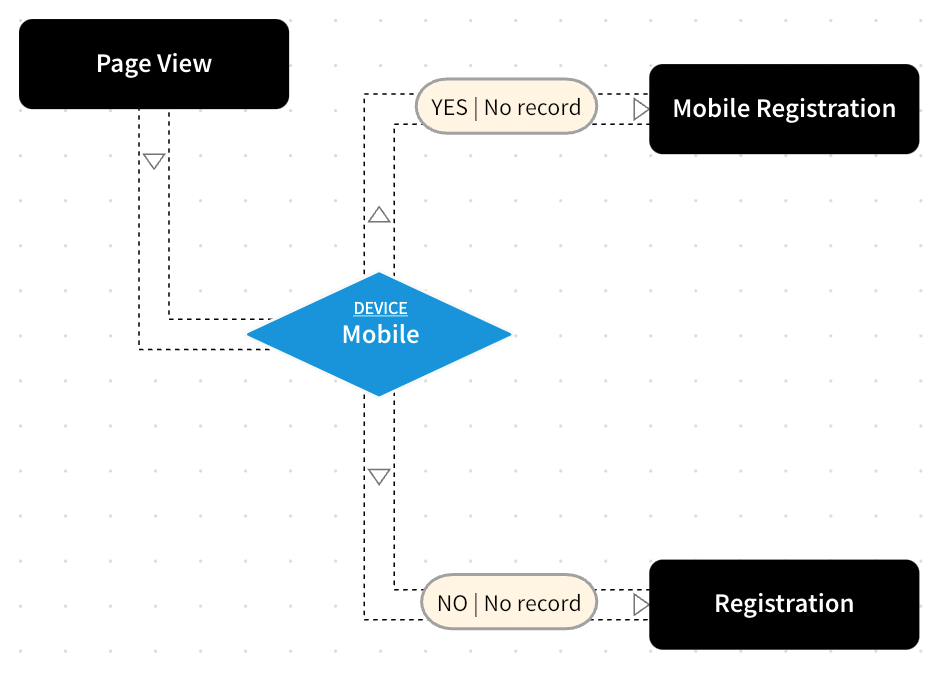
In the Analytics view, the connectors between your decision nodes and your outcomes display the output option and the data for that path.
If your rule does not yet have any associated data – for example, if it has recently been published – the data is displayed as No record, as illustrated below:
If your rule has associated data, the following information displays:
- The number of end users who have followed the path
- The percentage of traffic that followed the path
- If no end user has followed a path, the data is displayed as No record
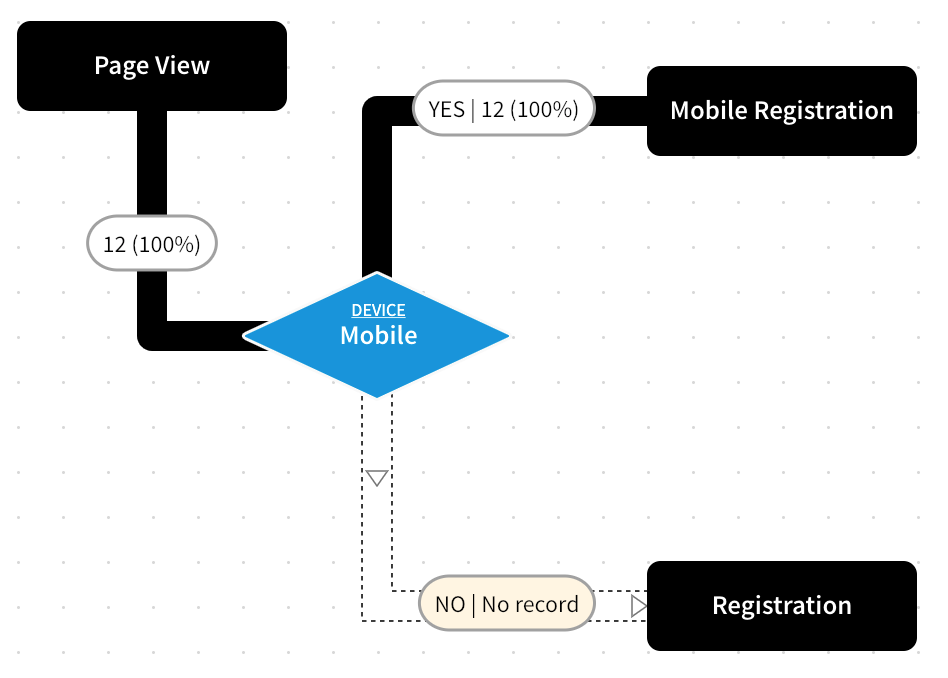
For example, the following analytics data shows that 12 end users, or 100% of traffic, have encountered the feature; and all end users accessed the feature using a Mobile device:
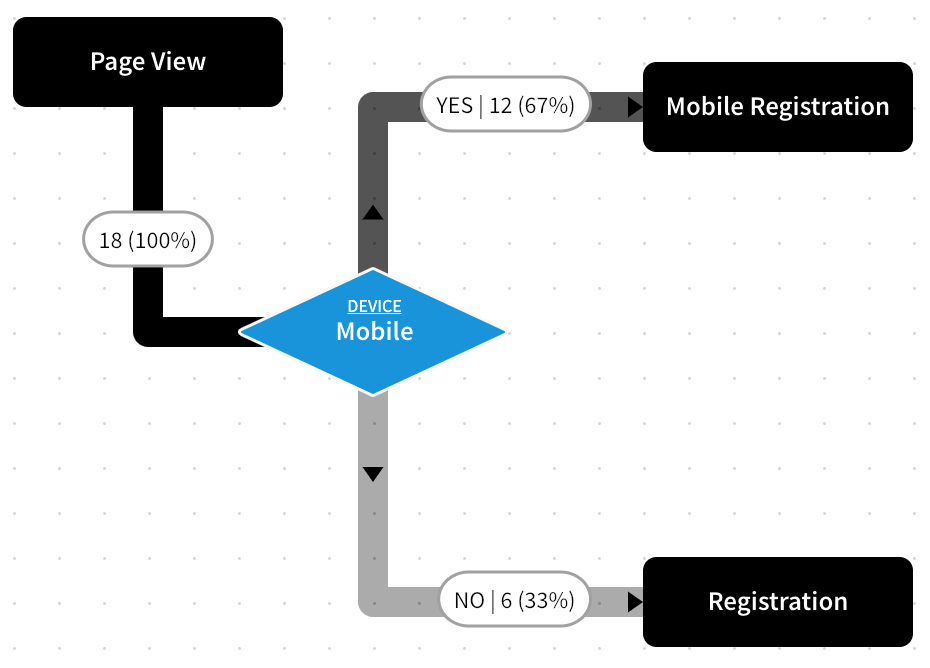
The connectors also provide visual feedback on the amount of traffic following each path with the path followed by the most end users being darker than those that are less-followed. The connectors are coloured as follows:
- Black, to show that 100% of traffic followed the path
- Shades of grey, to show that 99% (darkest grey) to 1% (lightest grey) of traffic followed the path
- White, to show that 0% of traffic followed the path
For example, the following analytics data shows that 18 end users, or 100% of traffic, encountered the feature; 12 end users, or 67% of traffic, accessed the feature using a Mobile device, and 6 end users, or 33% of traffic, accessed the feature using another type of device:
Understand the Data
You can use the data from the Zephr Journey analytics to inform decisions about your end users’ journey and subscription experience.
You can determine which path is most frequently followed, and use this information to determine the rules and outcomes that provide the most value to your business. Conversely, you can identify paths that fewer, or no, end users follow, and eliminate any rules and outcomes that do not provide value to your business.
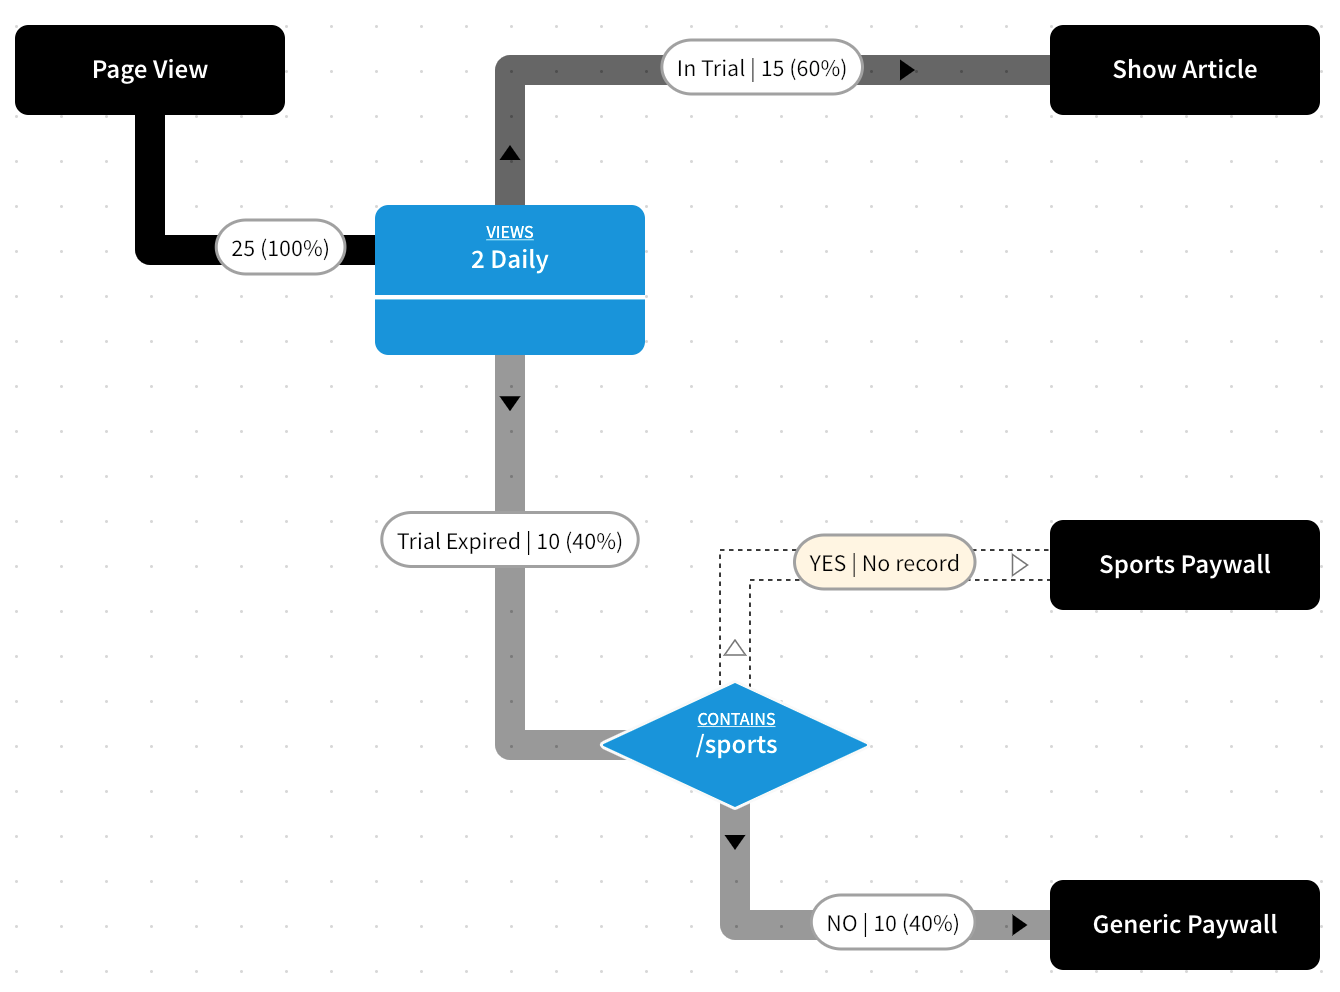
For example, the illustration below provides the following data:
- 25 end users encountered the feature
- 60% of the traffic were able to access the feature as part of a daily trial
- 48% of the traffic encountered a generic paywall when their trial expired
- No end users encountered the specialised Sports Paywall
You can use this data to tailor your rules to meet your business goals, as shown in the following examples:
- If you want to allow access to the feature for fewer end users, you can experiment by lowering the trial limit
- As no end users are viewing content on /sports at the end of their trial, you could consider the following:
- Invest less in this offering and its specific paywall
- Change the offering and specific paywall to offer access to another area of your site, such as /recipes, and examine the take-up of this offer