Measuring Zephr Paywall Performance with Google Analytics
The media industry is entering a new chapter on migrating from a transactional, ad-revenue model to one building lasting and profitable relationships with their readers.
Paywalls are not one size fits all approach. When deciding which resources to invest in when moving users across various experience journeys, it is of paramount importance to measure how these users are moving across your engagement funnels.
Setting up analytics is key to this process.
This guide details the basic foundation of how to implement paywall analytics using Zephr customer orchestration, Google Tag Manager and Google Analytics.
The Basics
If you have multiple domains, i.e. one domain for marketing, another one for content and the third one for e-commerce, we are assuming you have already configured subdomains and cross-domain measurement.
The following links will provide resources on setting up Google Analytics variables and Measuring Activity Across Domains.
Data Layer
The data layer is a piece JavaScript code which Google Tag Manager will use to collect various types of information. Typically, Zephr will push paywall relevant information to the data layer. The information Zephr can provide is grouped into the following categories:
User Schema: Information around the user attributes, i.e. Customer type, country, demographics, email preferences, etc.
Activity: Information about user activity: Login status, user id, etc.
Products: Details of the products the customer has subscribed to.
Feature outcomes: Information regarding the various “feature” events Zephr has created across the user journey: Soft/Hard wall outcome, footer, registration wall, etc.
A full guide on configuring the Data Layer is available here.
Once Zephr has passed on the various triggers and variables to the Data Layer, Google Tag Manager will be configured to access those values and define where those variables will be stored.
To use the data layer, the information needs to be added using key:value pairs.
This is an example of a Data Layer implementation:
var dataLayer = window.dataLayer = window.dataLayer || []; dataLayer.push({
'key1': 'value',
'key2': 'value' });
<!-- Google Tag Manager -->
Google Tag Manager Container Code
<!-- End Google Tag Manager -->
Common Issues Configuring the Data Layer
- The data layer should always exist just above the Google Tag Manager container.
- The last item in each array within the data layer should not end with a comma.
- String values should not contain apostrophes
- Currency values should be stored as strings, not integers.
- If a data layer variable has no value, provide an empty string.
Google Analytics
Custom Dimensions
Out of the box, Google Analytics provides a myriad of information regarding your visitors, pages and traffic. These include traffic referral, acquisition channels, geolocation, average time on site, pages per visit, and bounce rates are all metrics and KPIs that can be obtained as soon as you set up Google Analytics on your site.
Google Analytics Custom Dimensions allows you to customize metrics and fields, where you will store information relevant to your site.
For example, you can use Zephr and Custom Dimensions to obtain unique user ids, user attributes and paywall metrics. These will be critical in understanding how engagement contributes to your overall paywall strategy.
Segmentation can also be built on the back of Zephr pre-defined attributes.
For more information on how to build and use these custom dimensions please visit this guide on how to send custom dimensions and metrics using .js.
User and Paywall
By using custom dimensions in conjunction with Zephr Data Layer variables and Google Tag Manager, you can drive deeper insights into the type of articles users are most interested in and the articles or topics that are driving paywall hits.
Populating custom dimensions with user details can also provide valuable insights into your audiences. These user details will help identify relevant segments concerning content and paywall performance.
Details about users should persist throughout each visit and across devices. Zephr Data Layer feature ensures this data makes it to the data layer.
Examples of the type of information Zephr could provide to populate your Google Analytics custom dimensions include:
- Subscription Status
- Subscription Product
- Subscriber Age
- Renewal vs New
- NON-PII information
- Job title
- Marketing & Newsletter Preferences
- Country
- Login status
- Paywall type
- Paywall result
- A/B or multi-variant test groups
Important Note: Information about your articles will be supplied by your CMS. You will need to follow the same steps to integrate your CMS Data layer with Tag Manager and Google Analytics. Some of this information includes the article title, author, and published date.
Analytics Resources
Once you have integrated your Zephr Data Layer and analytics reporting is implemented, it is time to analyze and act upon this data. Google Analytics have different tools to measure performance and segment the data.
Setting up Goals, and using Standard and Custom Reports together with Segmentation will help you understand your paywall conversions and audiences.
In addition to the Data Layer, Zephr offers a BigQuery plugin that will enable for you to create a repository of all your paywall data points. BigQuery allows you to collate data points across a myriad of systems for use with Machine Learning and Business Intelligence solutions for analysis and visualization.
BigQuery is an enterprise data warehouse that will allow you to join the various data points across your customer journey: CMS, Registration, Paywall, conversion, etc.
For example, you could use this data for your Data Science to draw valuable insights to optimize and grow your paid subscriber base, i.e. Machine Learning segmentation in conjunction with advanced and attribution modelling.
We recommend you follow the Google Academy introduction to understand how all these metrics and variables fit within you reporting roadmap.
Goals
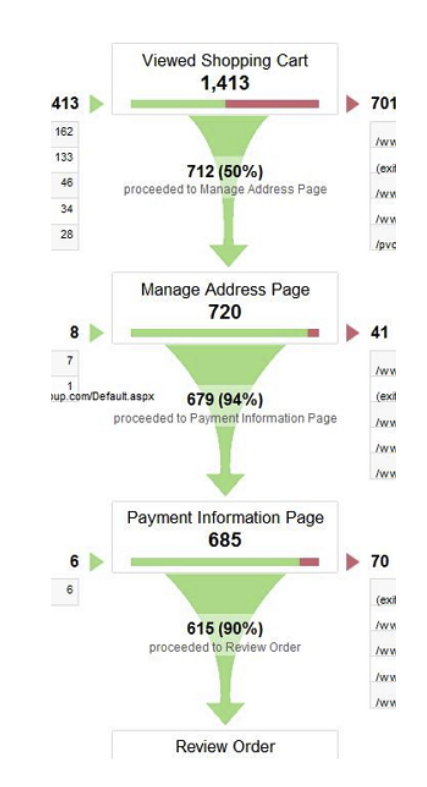
Setting up Goals in Google Analytics will allow you to measure micro-conversions.
You can set up goals to understand the relevant key interactions that the user performs to convert to a paying customer.
Micro-conversions such as promo clicks, paywall meter counters, newsletter signup, progressive profiling or form submission completion are some examples of the relevant micro-conversions you can configure using Goals to understand the conversion paths paying customers are following.
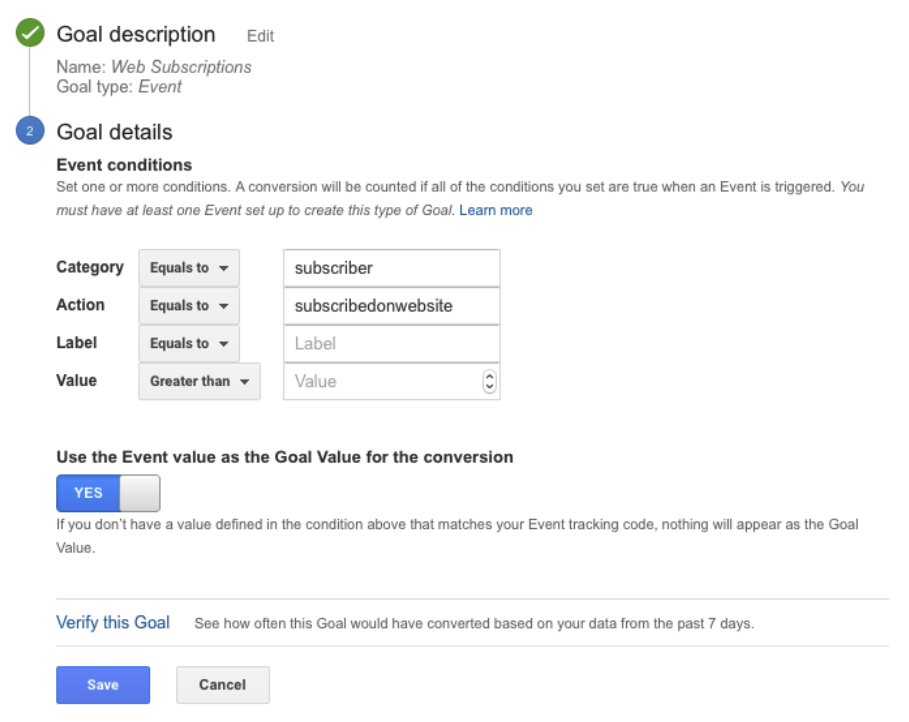
It is very simple to create, edit, and share goals in Google Analytics, these are valuable key milestones to understand your customer conversion funnel.
Summary
Google Analytics together with Zephr Data Layer and Google Tag Manager are an invaluable resource to understand the effect your paywall(s) have on revenue and user engagement.
We hope this document has helped you in better understanding the data and reporting ecosystem needed to build your paywall metrics and KPIs.
Please contact your Customer Success Manager or Technical Consultant for further details.