Optimize - Zephr Trend
Zephr Trend is a dashboard tool, provided as part of Optimize, which provides a summary of the behaviour of your end users across your sites. You can use the Trend dashboard to visualise key metrics along the subscriber lifecycle.
Note: To use Zephr Trend, you must use Zephr as your Identity Management Platform. This is because the data is populated from the user information stored in Zephr. If you use a third-party identity platform or JWT tokens, the Trend dashboard cannot be populated.
The dashboard provides insights essential information in an ever-evolving digital landscape, such as the following:
- The number of new subscribers over time
- Your top products
- The number of active users
- The subscriber churn rate
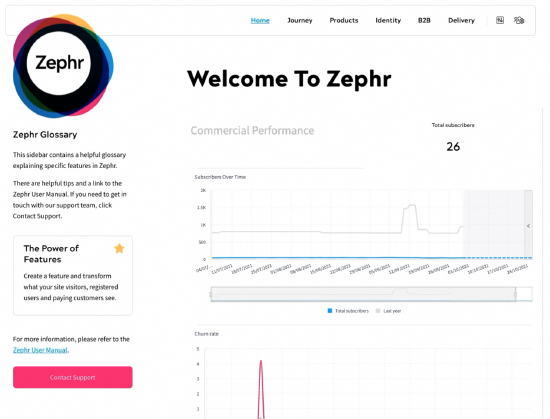
If you have Optimize enabled, you see the Zephr Trend dashboard on the home screen, as illustrated below:
You can return to the Trend dashboard from any screen in the Admin Console by selecting either of the following:
- Home from the main menu
- The Zephr logo on the left of the screen
The Trend dashboard contains the following sections:
- Commercial Trends
The Commercial Trends section provides data on the following:
- Subscribers over time
- Churn rate
- Top products
For further information on the data presented in the Commercial Trends section, see the Commercial Trends Data topic.
- Community Performance
The Community Performance section provides data on your registered users as follows:
- Total registered users
- Registered users over time
For further information on the data presented in the Community Trends section, see the Community Trends Data topic.
Note: Optimize also supports in-rule analytics using Zephr Journey. For further information on using Zephr Journey, see the Optimize – Zephr Journey topic.
Download Zephr Trend Data
You can download the information provided by each graph in your Zephr Trend dashboard as follows:
- For further analyses in other tools
- For inclusion in a presentation or report
To download the data from a graph in the dashboard, complete the following steps:
- Hover over the graph containing the data you want to download
Options display in the top right of the graph section, as illustrated below:

- Select the three dots
- Select Download
- Select the format in which you want to download the data. The options are as follows:
- Image
You can use the image in your presentations and reports.
- CSV File
You can upload the CSV file to another tool, such as Excel or an analytics tool such as Google Analytics or Tableau.
- Image