Administration and Monitoring
Monitor system integration health
The Overview section displays your environment status and the system's health at a glance. The environment's health is color-coded to indicate status and, when clicked, shows detailed activity metrics over time as data cards.
As indicated in the following graphic, you can inspect the system health for the last 24 hours.

Procedure
Complete the following steps to check your system health:
- Select a tenant associated with your company from the drop-down list at the top right. A subsequent drop-down appears if you are a multi-entity organization, allowing you to choose an entity name as displayed in the above graphic. For example, Production - NA indicates the tenant name and Global ID represents the entity.
Note: System health data displays findings at the entity level. By default, you will see the status individually for Billing, Platform, and Connect. If you are a Zuora Revenue customer, you will see Revenue. - View Zuora's component status.
- Red: Indicates that one or more child metrics are affected due to request failures or other issues related to an instance or an environment, and further investigation is required.
- Green: Indicates that the instance has passed the health check and reports nil problems.
- View the child metrics data card with details such as error count, order intake, performance, and taxation. You can click a metric to log in and view the detailed health statistics to investigate the issue further.
- To access the tenant and click the card through, migrate your local user account or create user groups. For more information, see Manage user and group provisioning in OneID.
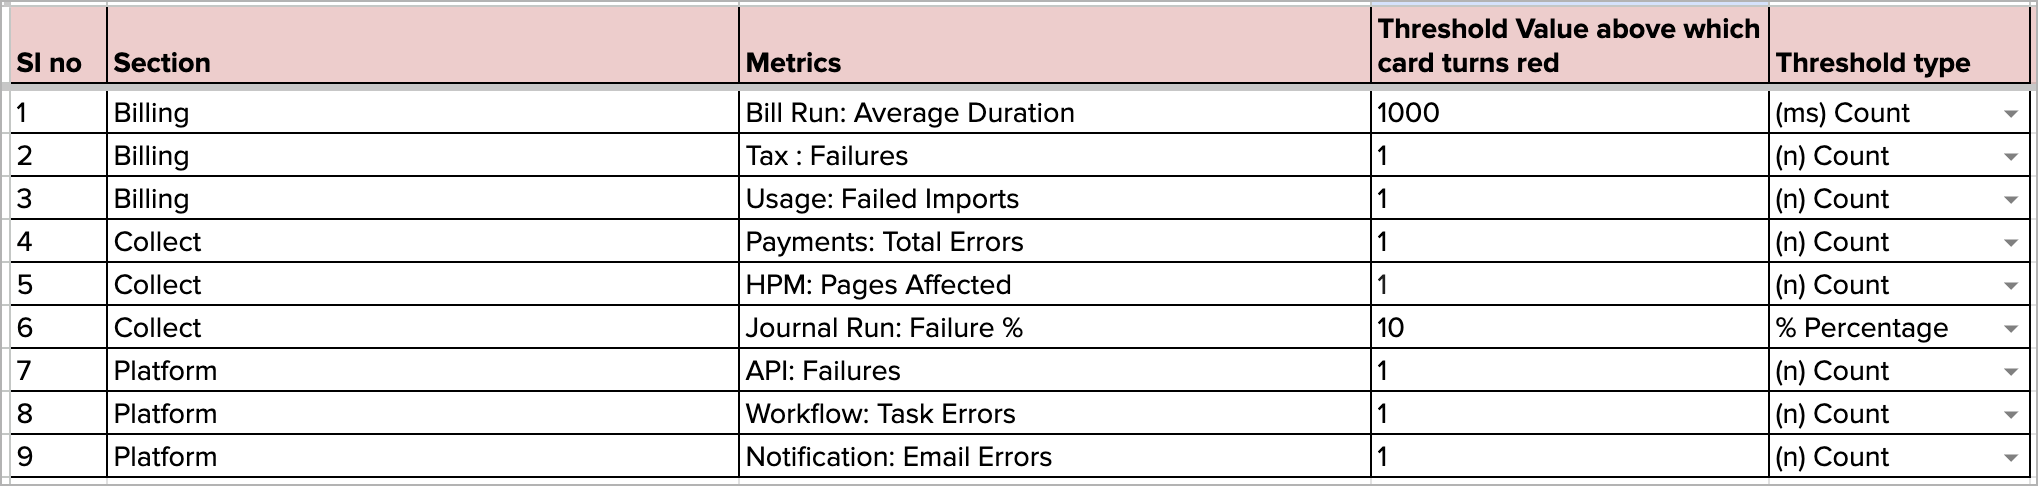
Threshold of health status
The threshold limits that change the environment's health status from green to red can be viewed in the following image:
View contractual consumption
View your contract's progress against allowances to forecast upcoming overages and manage your budget with subscription creation.

- Billing Volume: Shows your current invoice volume (transaction volume) versus the contractual allowance. For example, the committed volume is 165 M, and the billing usage volume is 45 M. A snapshot of the committed volume is taken at each month's end.
- Revenue Volume: Shows the revenue transaction volume versus the contractual allowance.
- Active Subscribers - Billing: Displays the number of active subscribers; a snapshot is taken at the end of each month.
- Dates: Dates indicate the contract term or overage term.
Monitor and track admin actions and resources
The Administrative Actions and Resources section offers a centralized platform to monitor and manage organization, tenant, user, user role, user group and more in the Zuora system.
The following fields are included in this section as entry points to monitor and enhance performance.
| Field | Descriptions |
|---|---|
| Sandboxes | Select Refresh Existing Sandbox to access your test environments on the Platform. |
| Tenant Settings |
|
| Users | Click Manage Users to view, edit, deactivate, or reactivate users in OneID. For more information, see Manage users in OneID. |
| Resources |
|
| Support | Use Zuora's Support Centre for issue identification, diagnosis, and resolution. |
View and manage tenants
Tenants are quick review data cards to understand and monitor the connection status of the system-integrated production and sandbox environments of the tenant. The tenant data card is created with varied information that signifies the impact on the system's health.
The image below is the view based on the tenant details:

- Name: Name of the tenant.
- ID: Displays the Tenant ID, the Zuora product (Billing or Revenue), and the tenant's region(US or EU).
- Trust Status: Displays Zuora’s system status.
- Performance: Indicates the status of overall performance across all system health dashboards of the tenant.
- Errors and Failures: Indicates the status of overall errors across all system health dashboards. A warning shows up if the error thresholds exceed for any dashboard.
- Log in new page: Click this icon to redirect you to a new page with details specific to the tenant.
- Hierarchy: This indication appears if you are a multi-tenant entity.
Status values for connection
The image below is the view based on the status values for connection:

- Active: The tenant is active.
- Inactive: The connection between the tenant and Zuora’s enterprise is inactive or de-provisioned.
Trust status
You can view the trust status for each tenant without having to log on to trust.zuora.com. The trust status reflects metrics specific to a tenant than displaying information about a data center in general.
The data card display shows the status, major incidents, and significant infrastructure changes for the EU and NA region data hosting centers. Clicking on the status shows a flyout with the sub-status of each component.
