Zuora Connector for Salesforce CRM dashboard
Zuora System Health dashboard for Zuora Connector for Salesforce CRM collects and displays real-time usage, failure, and performance data. Through the Zuora Connector for Salesforce CRM dashboard, you can view data about object sync in your Zuora tenant within the last seven days. You can use this dashboard to detect data connect issues and troubleshoot.
This article contains the following information about the Zuora Connector for Salesforce CRM dashboard:
- Definition of the Zuora Connector for Salesforce CRM metrics
- Filter, view, and drill down the data in the dashboard
- Failure retry function
- Manual sync cancellation
For more information about the System Health feature, see Zuora System Health.
Prerequisites
To access this dashboard, ensure that the following requirements are met:
- System Health is enabled for your Zuora tenant.
- Ensure that the Zuora tenant you are using has the most up-to-date version of the Salesforce Data Connect - Zuora connector for Salesforce CRM.
- You are assigned the Access System Health Dashboard permission.
For more information, see Zuora System Health prerequisites
If you cannot access this dashboard, check with your administrators.
Access Zuora Connector for Salesforce CRM dashboard
To access the Zuora Connector for Salesforce CRM system health dashboard, follow these steps:
- Log in to your Zuora tenant.
- Navigate to Administration > System Health in the left navigation menu.
- Within the System Health section, click Zuora Connector for Salesforce CRM.
Zuora Connector for Salesforce CRM metrics
The following table provides descriptions of the Zuora Connector for Salesforce CRM metrics.
| Metric | Description | ||||||||
|---|---|---|---|---|---|---|---|---|---|
| Data Connect Overview (Total Objects Synchronized) |
The number of object sync requests sent within a specified time range and details of each request, including successful and failed sync. When hovering over each time interval bar, you can view the breakdown data of that time range.
|
||||||||
| Data Connect Failures (Failed Record Synchronized) |
Records that were not successfully synchronized from Zuora to SFDC. You have the option to view the full error message for any specific failed record. There are three categories of error codes, which are outlined in the reference table below:
|
||||||||
| Data Connect Performance (Sync Latency) |
Data sync time from Zuora to Salesforce within a specified time range.
When hovering over each time interval point, you can view the breakdown data of that time range. |
You can configure notifications based on the Data Connect Failures or Data Connect Performance metrics. For more information, see Standard events for Zuora Central Platform.
View data in the Zuora Connector for Salesforce CRM dashboard
Zuora Connector for Salesforce CRM dashboard contains a data summary section and three tabs that display the usage, failure, and performance data related to data connect separately.
This section is located at the top of this dashboard, encompassing the following data boxes that display data summaries within the last seven days.
- Data Summary section: This section is located at the top of this dashboard, encompassing the following data boxes that display data summaries within the last seven days.
- Total Sync'd: This data box displays the total number of successful sync within the last seven days and the week-over-week change in the number.
- Total Sync Errors: This data box displays the total sync errors generated within the last seven days and the week-over-week change in the number.
- Sync Error Rate: This data box displays the average sync error rate within the last seven days and the week-over-week change in the percentage.
- Median Latency: This data box displays the median execution duration (hh:mm:ss.ms) of sync within the last seven days and the week-over-week change in the average duration.
- Overview tab: This tab displays the data of the Total Objects Synchronized metric.
- Failures tab: This tab displays the data of the Failed Record Synchronized metric.
- Performance tab: This tab displays the data of the Sync Latency metric.
After you open a tab, you can take the following steps to view the data.
- Configure filters.
You can customize the data to be displayed by using the filters.- In the upper right of the dashboard, click the Filters icon.
- Use the Timeframe, Start Time, End Time, Syn Mode, Data Object, Status, and API Action fields to specify the data you want to view. The Data Object drop-down displays the list of object names you want to view.
Note that you can switch between Real Time and Manual Sync modes. You can modify the sync modes by applying filters within the Sync mode field. In manual sync mode, you can click on the manual sync job ID in the table to access details through a pop-up modal. If any data object failures, the count will be presented as a clickable link. You can download a maximum of 20,000 failed records by clicking on this link.
- Click Apply to apply the filter or Reset to go back to the default filter configuration.
2. View the trend charts.
- Select the time interval of the charts using the interval radio buttons (Day, Hour, and Minute) in the upper right of the chart.
Note that available interval options vary based on the length of the selected time range. Only the Day Interval is enabled when the range exceeds 60 hours. - When hovering over each bar or point, you can view the breakdown data of that time range, which contains the change percentage compared to the previous interval.
3. Use the table below the trend chart to view detailed data within the selected time range. The detailed tables are available under the Overview, Failures, and Performance tabs.
- By default, the table displays all the items within the specified time range. You can narrow the scope to a specific interval by clicking a bar in the chart. To go back to the global time-range set in the filter, click Clear next to the specific time range displayed above the chart.
- Click the Filter icon in the upper right of the table to list the data you want to view. When you finish configuring the filter, click Apply. Click Clear to withdraw the configuration.
- On the Overview tab, you can view the below details:
- Object Id or Job Id (Object Id for Real Time Sync and Job Id for Manual Sync)
- Sync Mode
- Data Object
- API action
- Start Time
- End Time
- Sync Status
- On the Failures tab, you can view the below details:
- Object Id or Job Id (Object Id for Real Time Sync and Job Id for Manual Sync)
- Sync Mode
- Data Object
- Start Time
- End Time
- Error Code
- Error Message
- Details - Includes API Action and Trigger By attributes.
- On the Performance tab, you can view the below details:
- Data Object
- API action
- Records Synced
- Sync Mode
- P50
- P90
- P95
-
Click the download icon
located above the table on the right side to download the table as a CSV file.
-
Click the Details link at the end of the row to view the detailed failure message in the Failures tab.
Failure retry function
The Failure Retry Function in the Zuora Connector for Salesforce CRM dashboard allows you to retry failed records during real-time synchronization. Here's how to use this function effectively:
Ensure you have access to the Zuora Connector for Salesforce CRM system health dashboard and have identified records that failed during real-time sync before proceeding.
- Go to the Zuora Connector for Salesforce CRM dashboard and click on "Failures" from the menu.
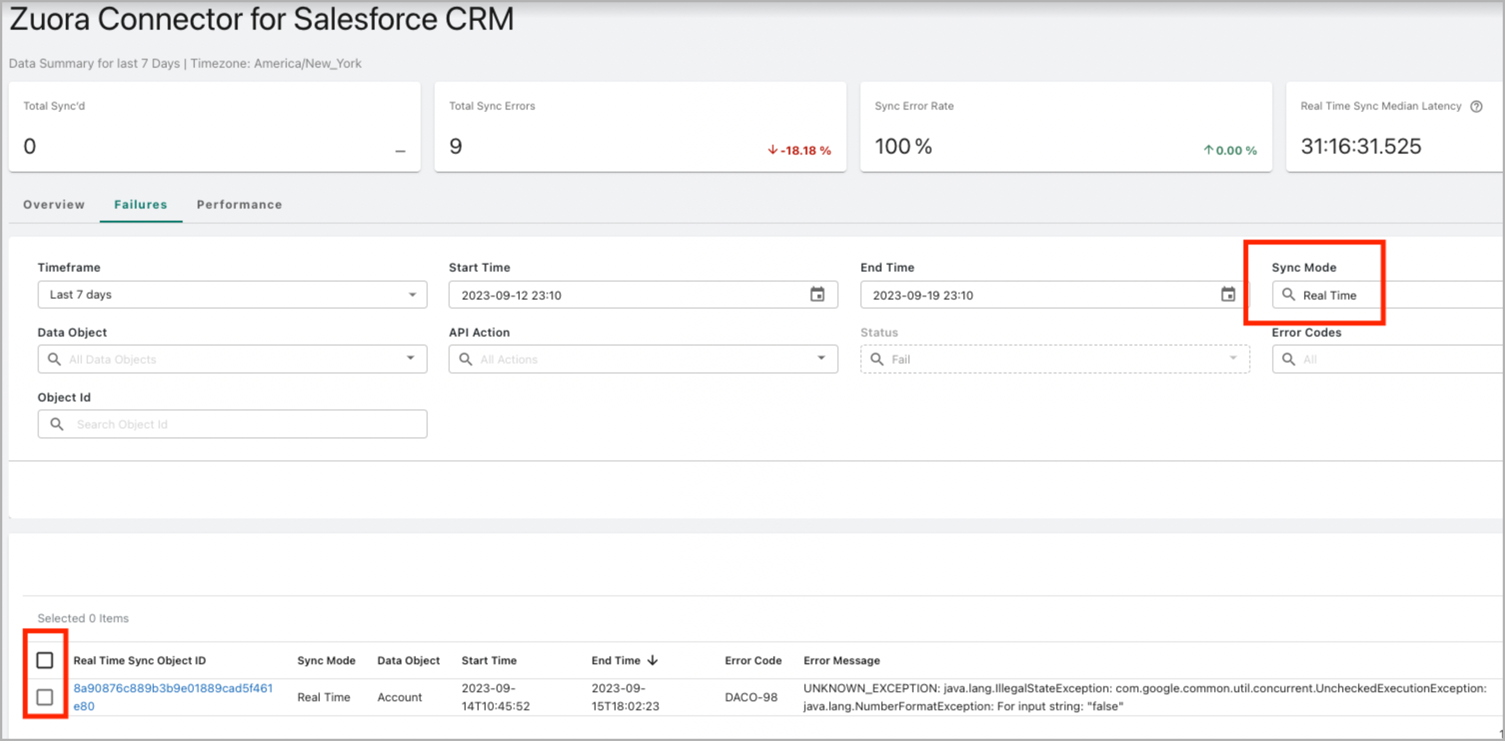
- In the Sync Mode dropdown field, choose "Real Time."
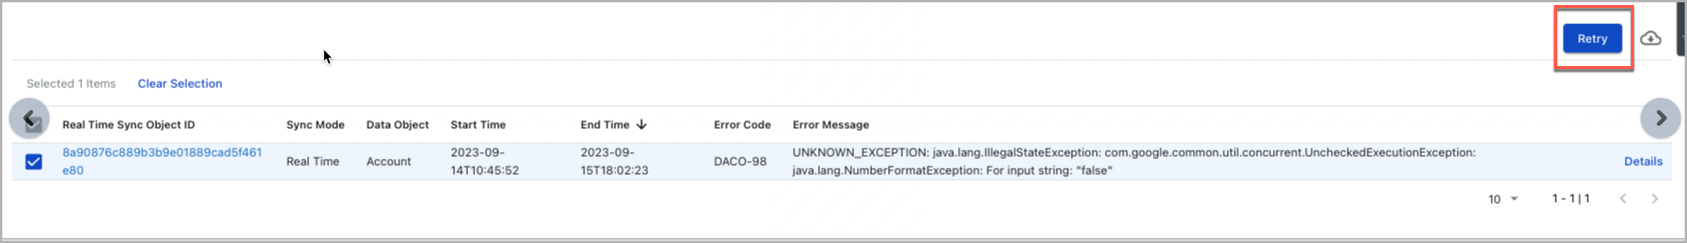
- Select the objects that require a retry. Once you have chosen one or more objects, the Retry button will become active and clickable.
- Click on the Retry button, and a message indicating success or an error will be displayed after the Retry button is clicked.
Manual Sync cancellation
The manual sync cancellation feature in the Zuora Connector for Salesforce CRM dashboard allows users to cancel initiated manual sync jobs. This functionality provides flexibility and control over synchronization processes. Follow the steps below to effectively cancel a manual sync job.
Steps to Cancel Manual Sync
-
Access the Dashboard:
- Navigate to the Zuora Connector for Salesforce CRM dashboard.
- Click on "Performance" from the menu to access the performance-related options.
-
Filter Manual Sync:
- Click on the Filter Icon to refine the displayed information.
- Choose "Manual Sync" from the Sync Mode dropdown field to filter the synchronization jobs specifically initiated manually.
-
Locate Manual Sync Job:
- Scroll down to the "Manual Sync Status" section to view the list of manual sync jobs.
- Identify the manual sync job you want to cancel based on the provided information.
-
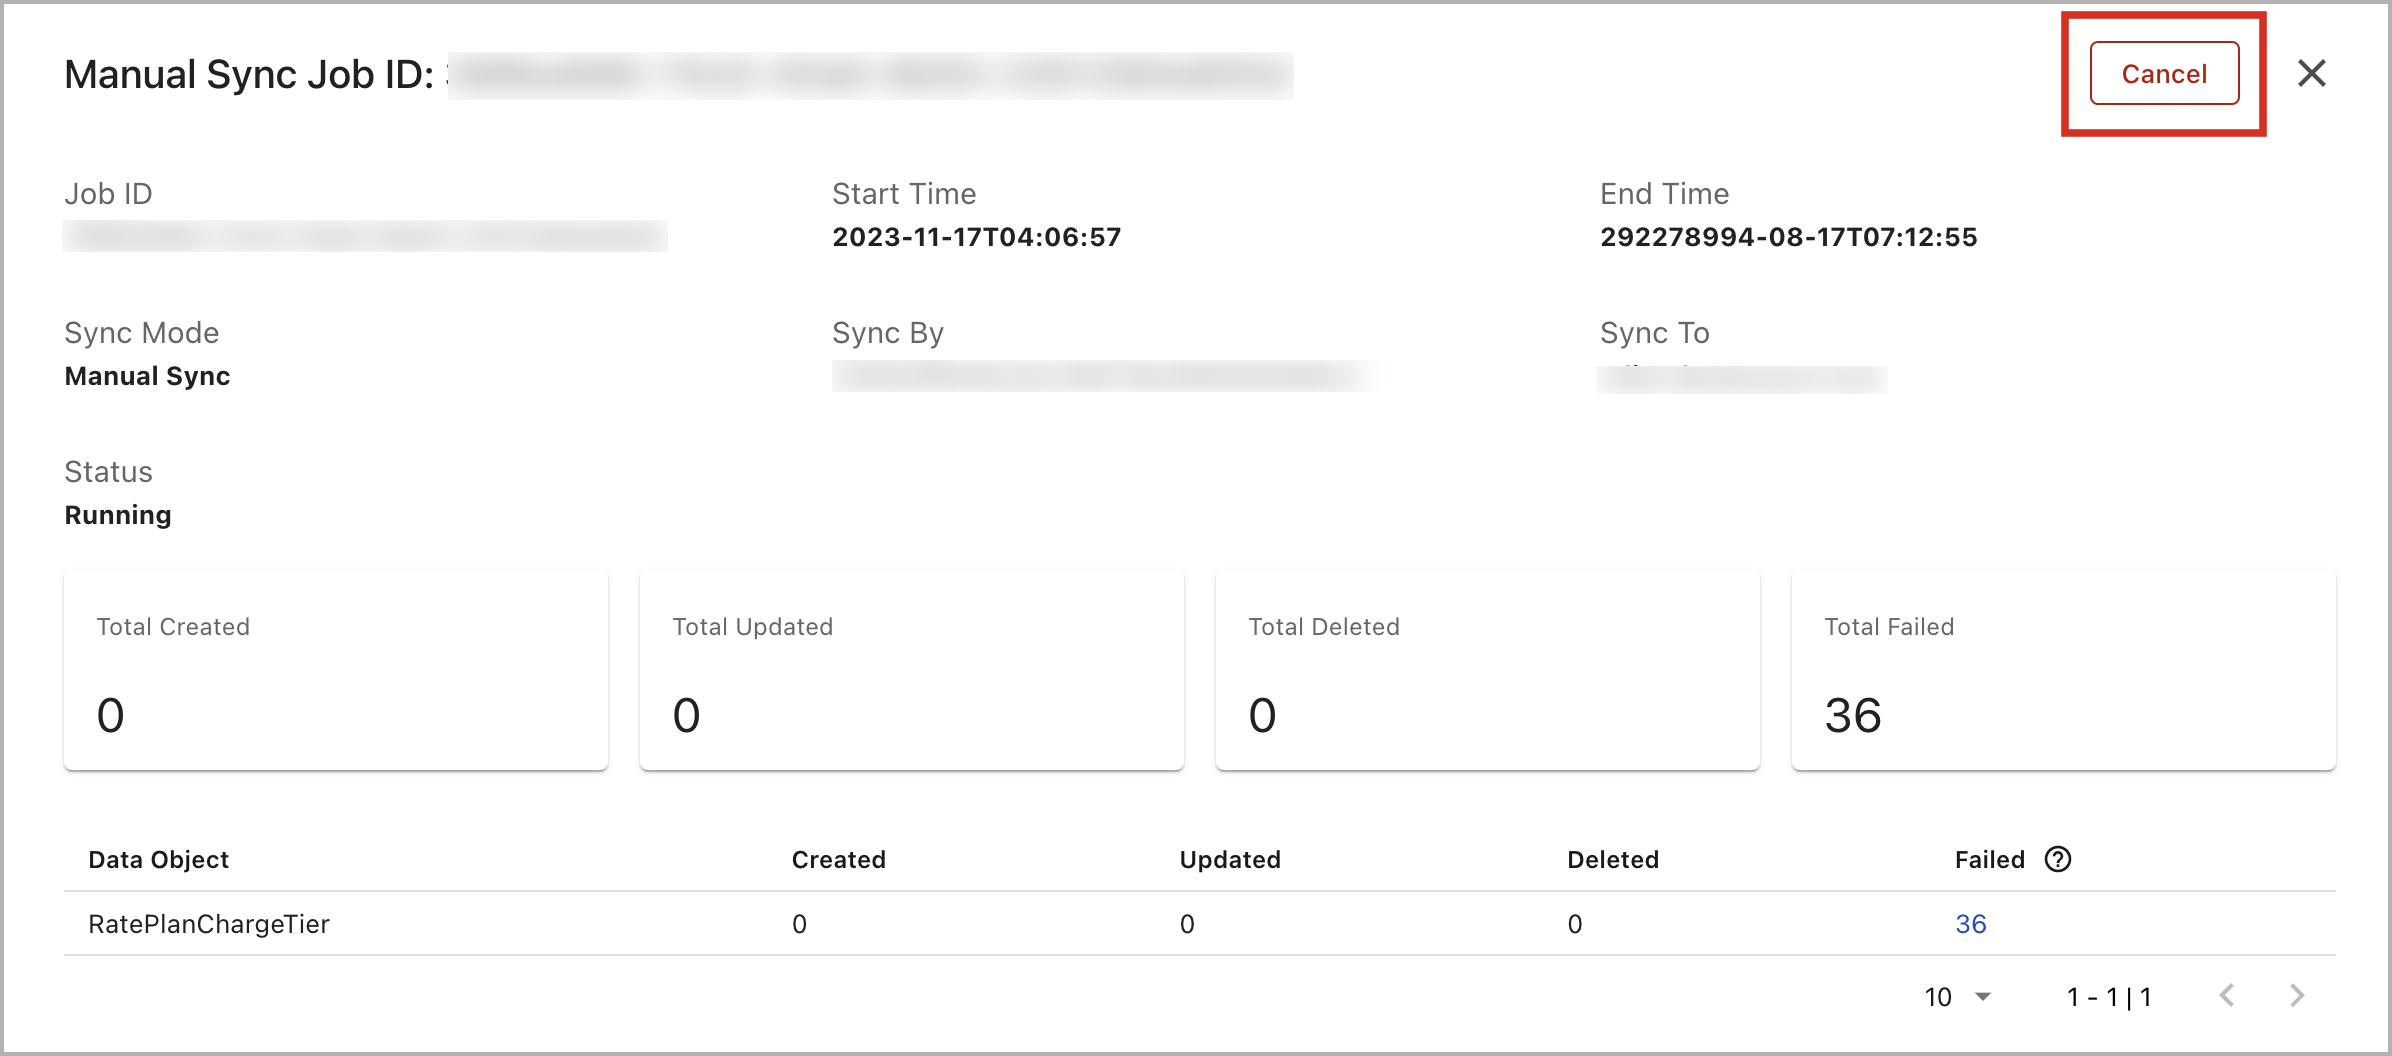
Initiate Cancellation:
- Once you have located the manual sync job, you will find a "Cancel" button associated with its job ID.
- Click on the "Cancel" button to initiate the cancellation process.
-
Confirm Cancellation:
- A confirmation dialog box will appear, asking if you are sure you want to cancel the manual sync job.
- Click on "Yes" to confirm the cancellation.
-
Optional: View Detailed Information:
- If needed, click on the Manual Sync Job ID to access detailed information about the sync job.
- From this detailed view, you can also find the "Cancel" button to cancel the sync job directly.