Getting started with revenue analytics dashboard
The revenue analytics dashboard works as an interactive and actionable management dashboard and can be accessed from the Dashboard main menu. Filter and data export functionalities are applicable for all tabs.
- Overview: This is the default tab. The Overview tab displays the total revenue and booking data as well as a breakdown of revenue by product family. You can also view the revenue and booking data by customer.
- Revenue Insights: Displays the detailed summary on revenue by product family, revenue contract summary, and balance.
- Top Bookings: Displays the top 10 bookings by customers, products, and product families.
- Forecast: Displays the forecasted future revenue.
- History: Displays the revenue trends and bookings trends based on the specified filters.
The following sections describe how to view, filter, and understand the data on the revenue analytics dashboard.
View the dashboard
To view the default dashboard, navigate to Dashboard > Revenue Analytics. The Overview tab opens by default and displays key revenue metrics. The default data displayed in each tab belongs to the current open period.
Hover your mouse over a card to see a set of icons and options to take action on the card. Hover your mouse over the filter icon on a card to see the applied set of filters. These are the same set of filters that appear on the Filters pane. For more details on the filtering options, see Filters in dashboard.
Changes in your Zuora Revenue data take an average of 20 minutes to appear in the dashboard. The dashboard displays the date and time when the data was last updated.
Overview tab
The Overview tab displays the amounts of booking data, revenue, and detailed revenue by product family view. It also provides an option to view the revenue and bookings by customers.
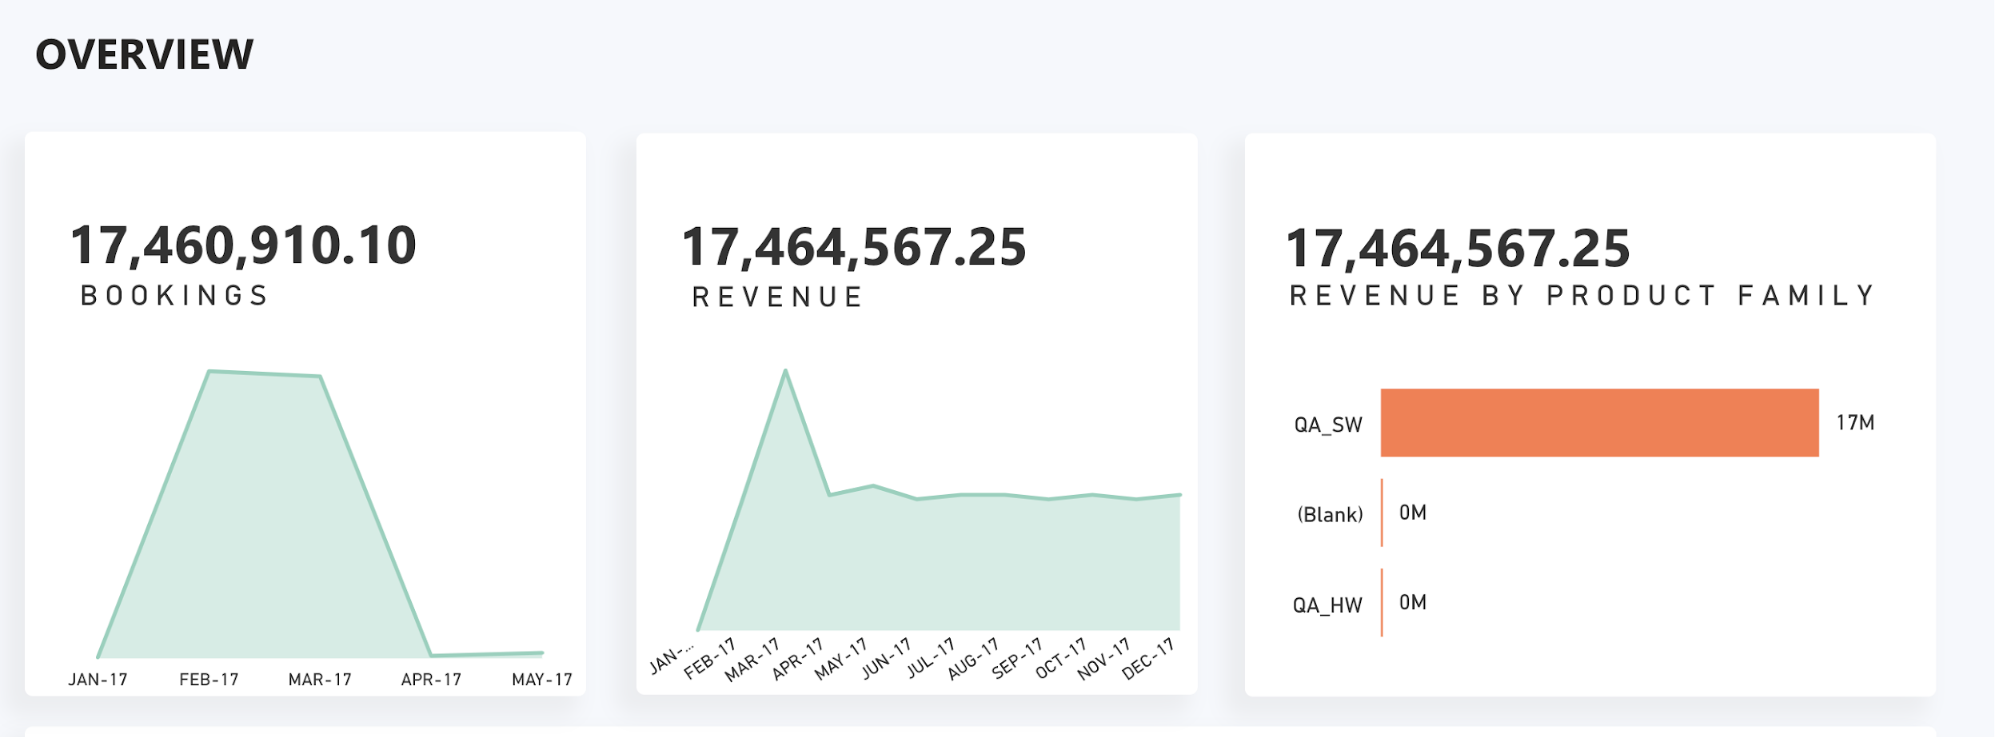
The following cards are available in this tab. Selecting a data point on any of the cards will automatically filter all other cards as well.
| Card name | Description |
|---|---|
| Bookings | A filled line graph view that presents the total bookings for each month in the current financial year. You can also select any specific month for this view to interactively see the changes. |
| Revenue | A line chart that presents the total revenue and month-wise revenue breakdown. |
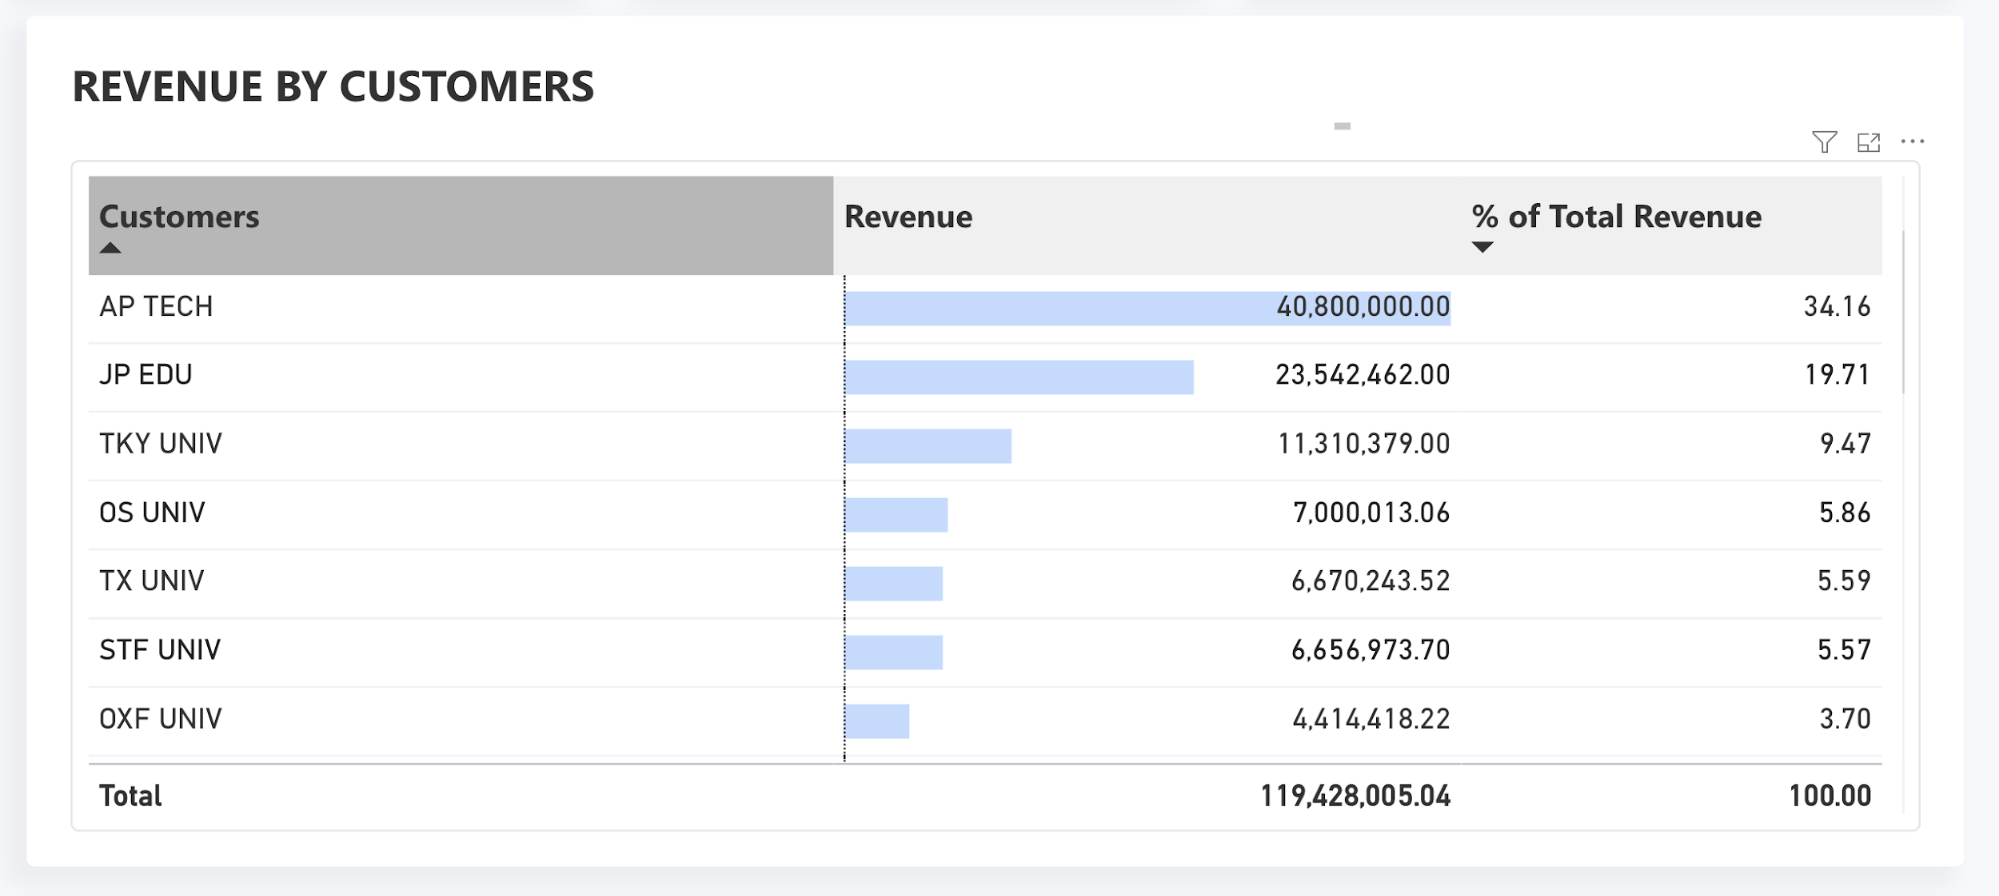
| Revenue by Customers | A tabular view that presents customer names, their generated revenue, and percentage of revenue contribution to the total. |
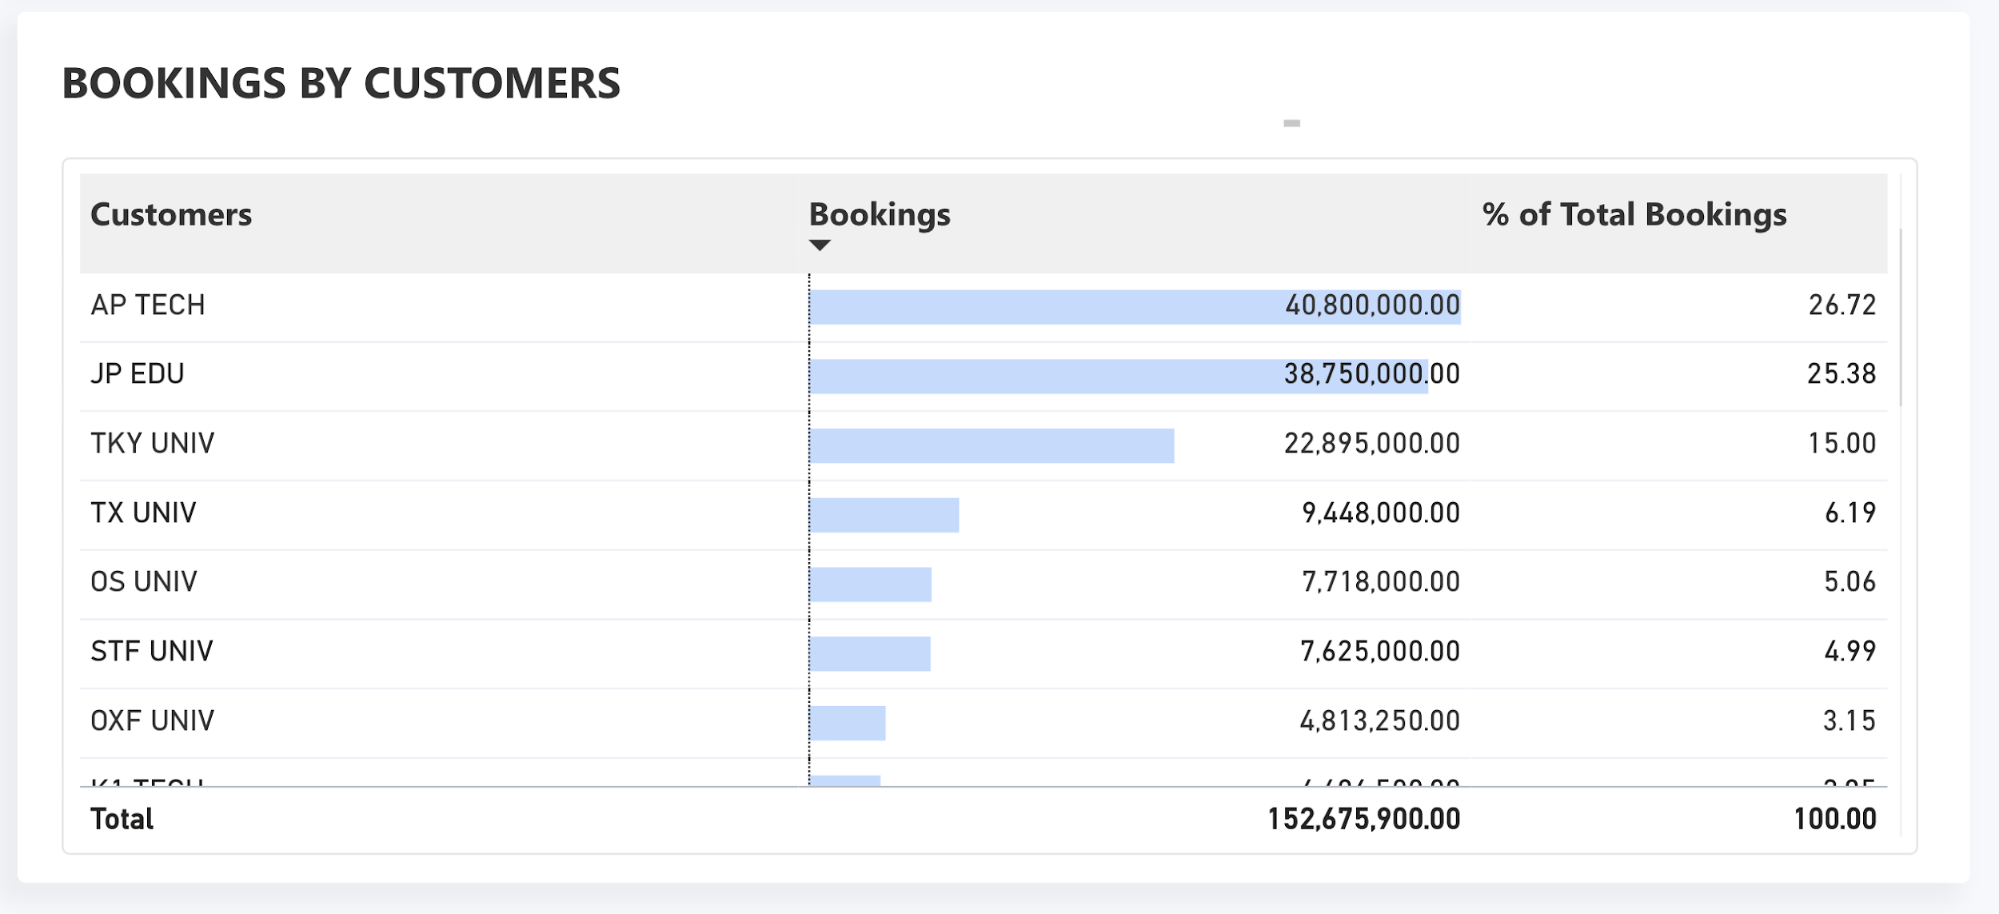
| Bookings by Customers | A tabular view that presents customer names, their generated booking value, and percentage of revenue contribution to the total. |
| Booking by Product Family | A horizontal bar chart that presents the revenue distribution based on the family of products. |
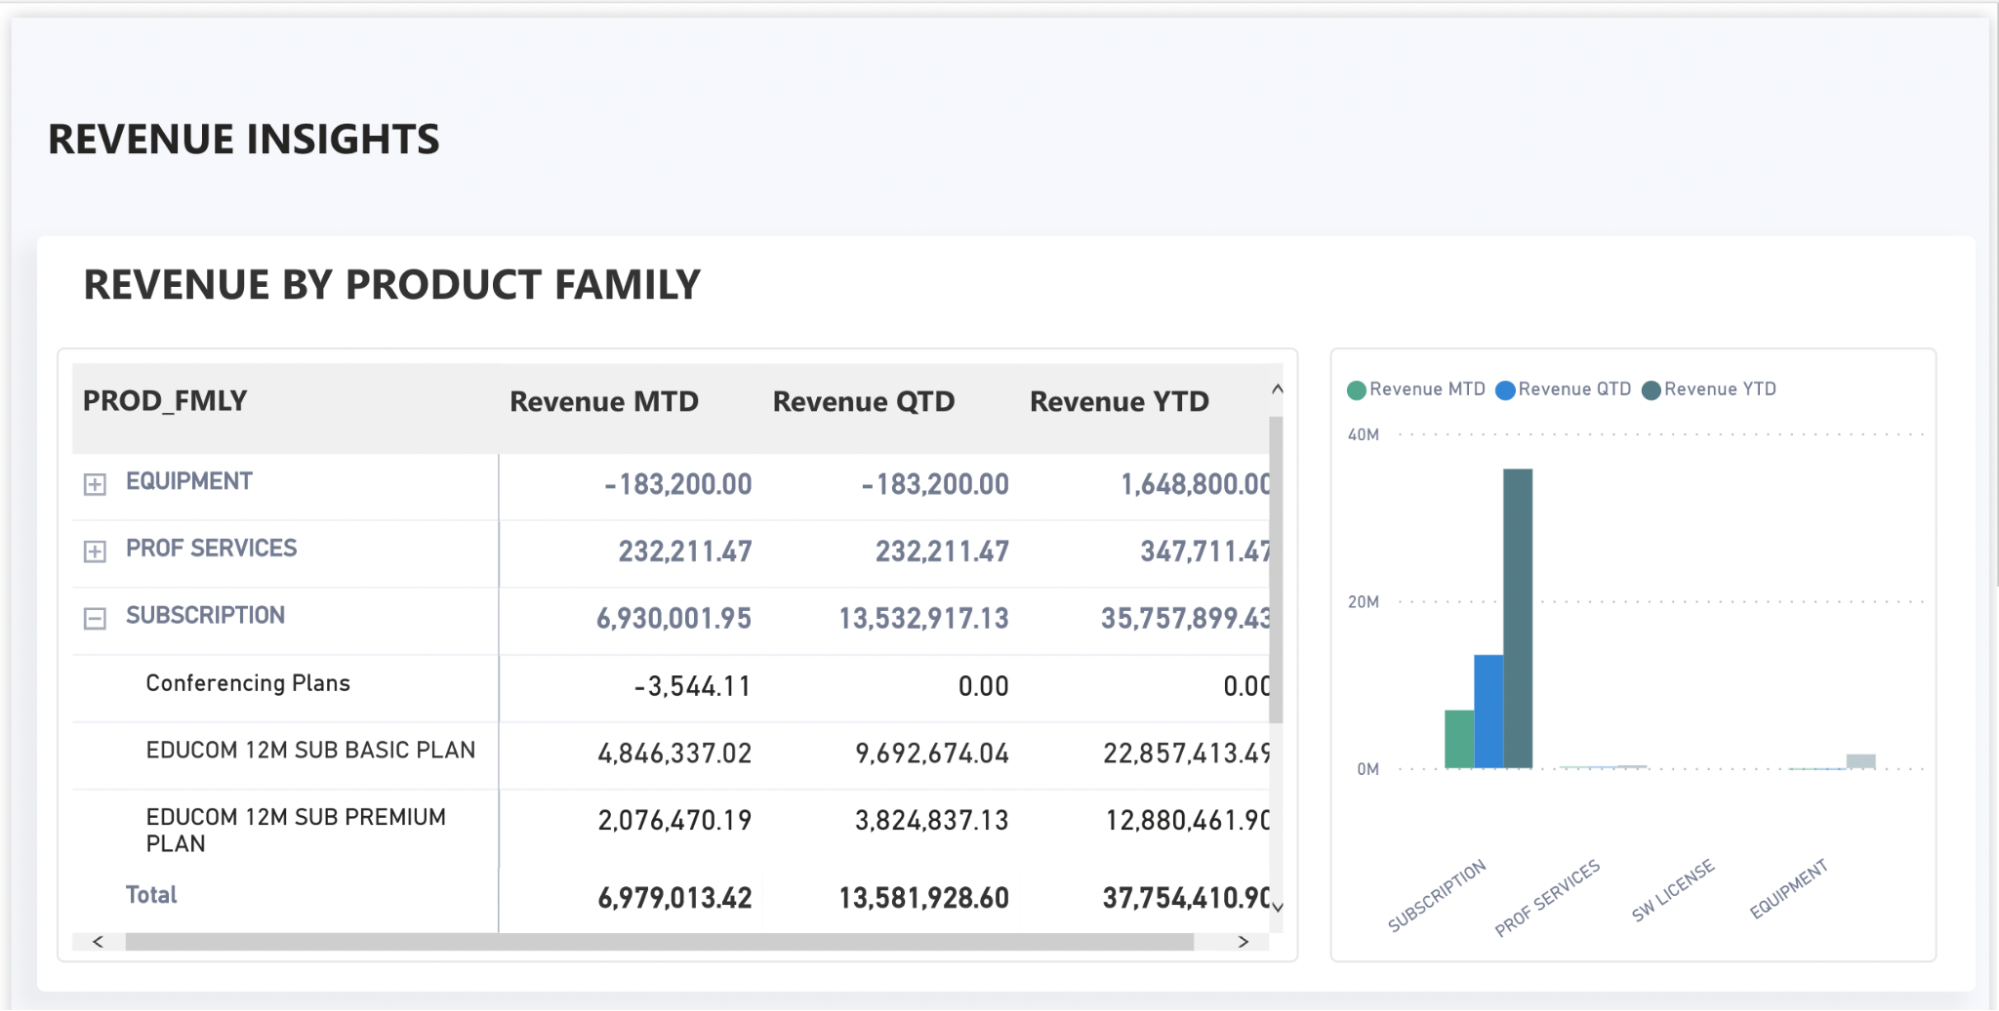
Revenue Insights tab
The Revenue Insights tab provides a detailed summary on revenue by product family, revenue contract summary, and balance.
The following cards are available in this tab. Selecting a data point on any of the cards will automatically filter all other cards as well.
| Card name | Description |
|---|---|
| Revenue by Product Family | A tabular view and a bar chart to present the details of revenue distribution across product families. The product-level revenue distribution is further categorized into MTD, QTD, and YTD. |
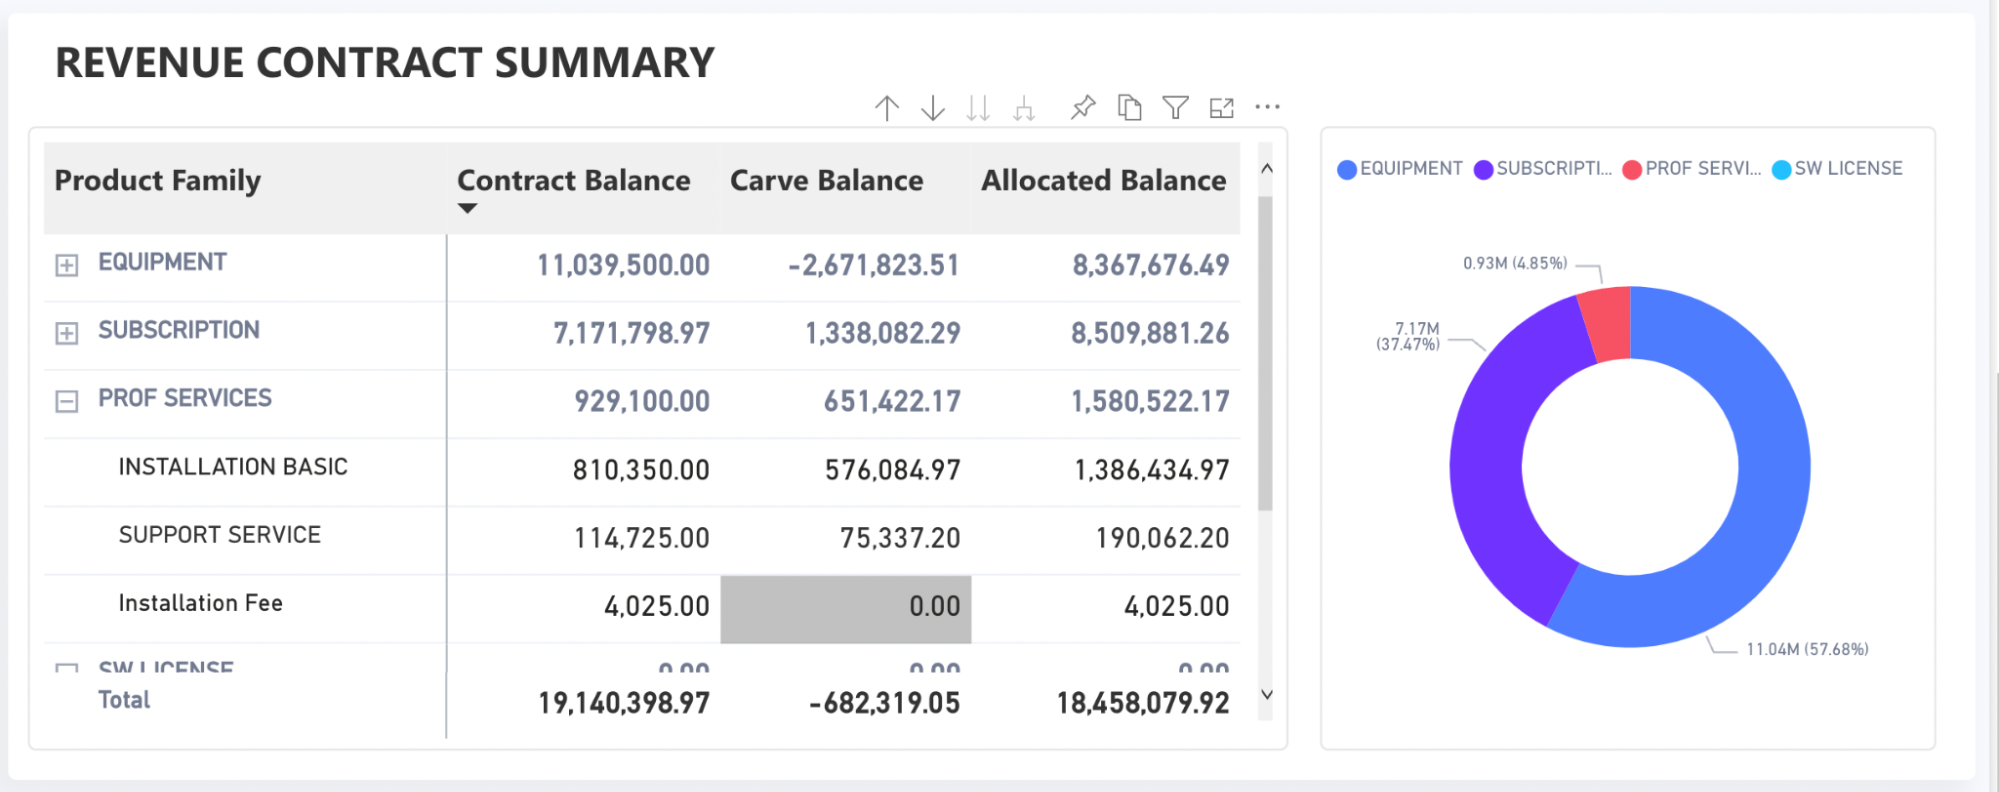
| Revenue Contract Summary | A tabular view and a doughnut chart to present a summary by product family and product-level contract summary showing details into contract balance, carve balance, and allocated balance. |
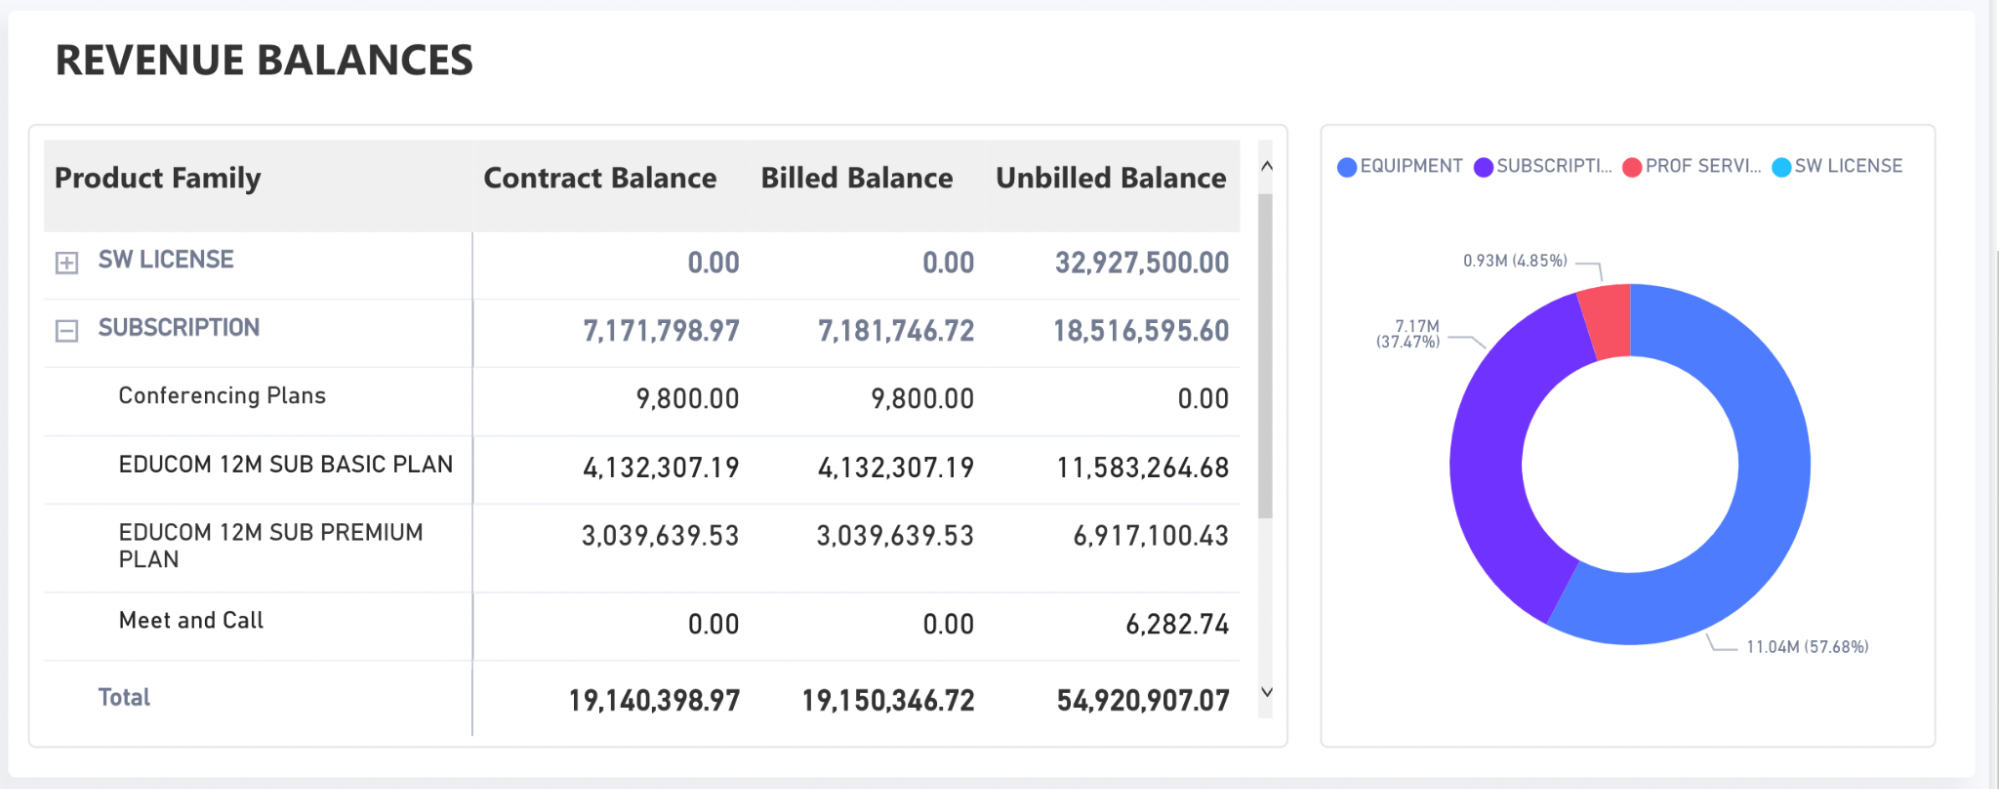
| Revenue Balances | A tabular view and a doughnut chart to present a product family and product-wise distribution of billed and unbilled balance. |
Top Bookings tab
The Top Bookings tab shows the top 10 bookings by customers, products, and product families with cards to summarize the bookings over the date, quarter, and year.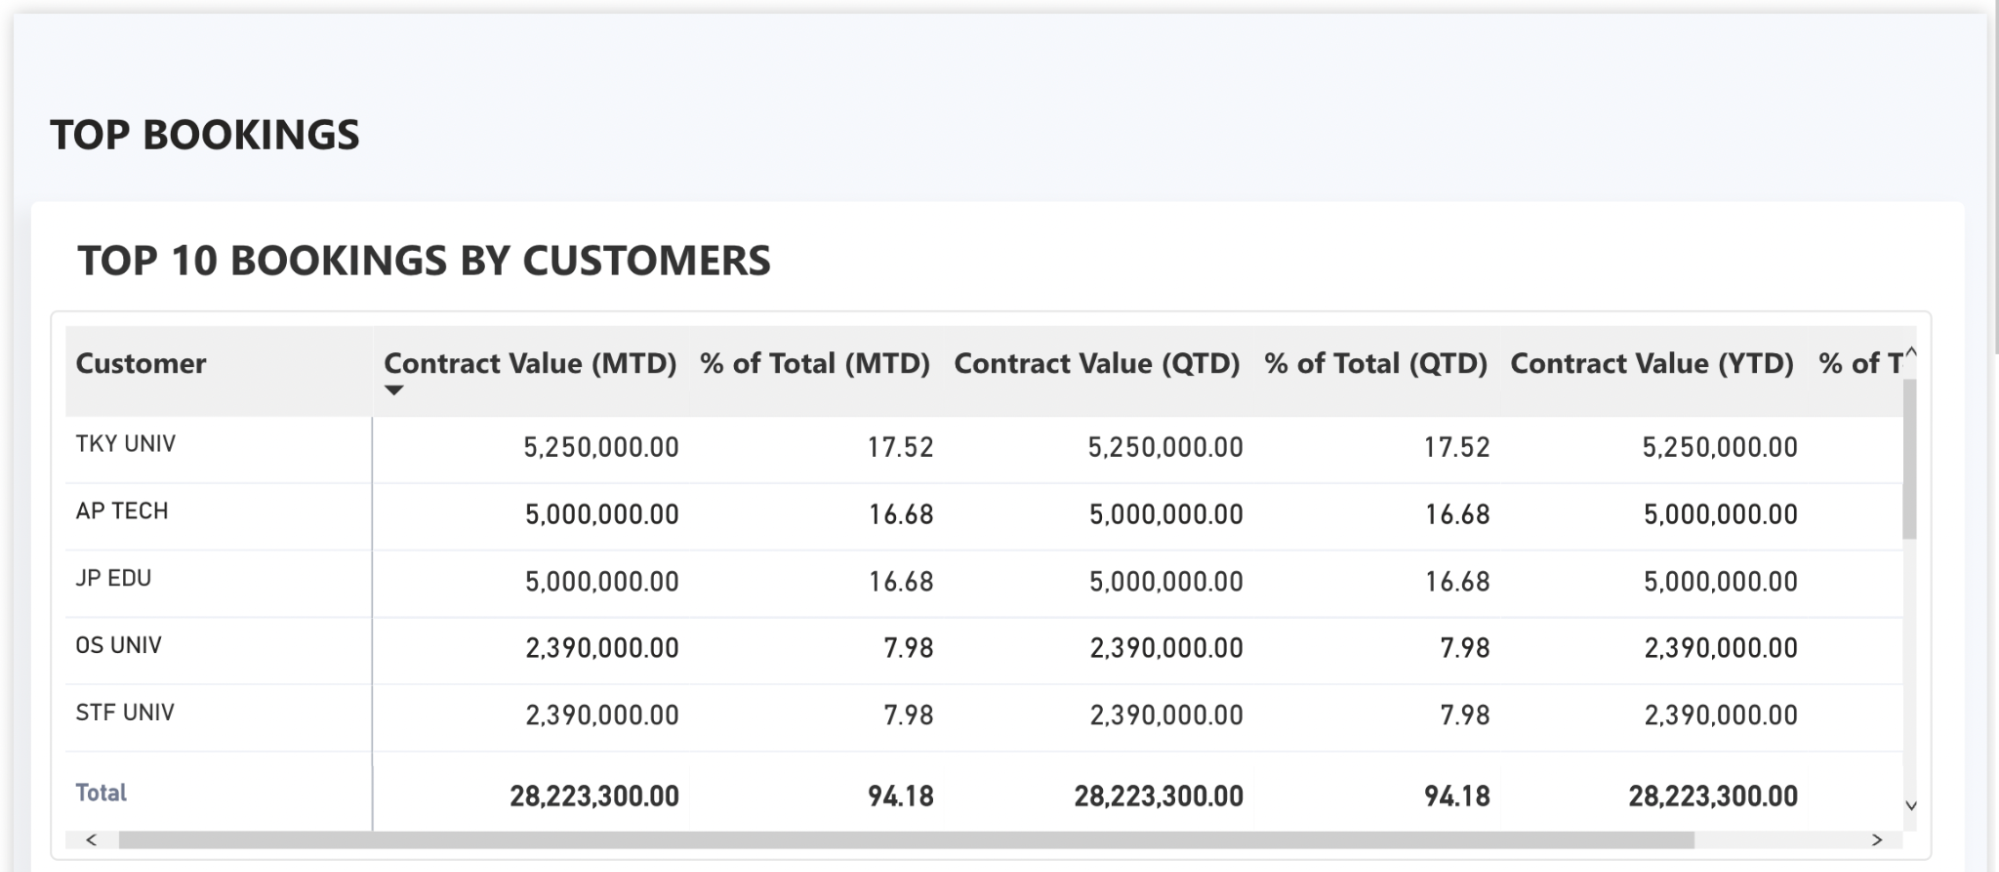
The following cards are available in this tab. Selecting a data point on any of the cards will automatically filter all other cards as well.
| Card name | Description |
|---|---|
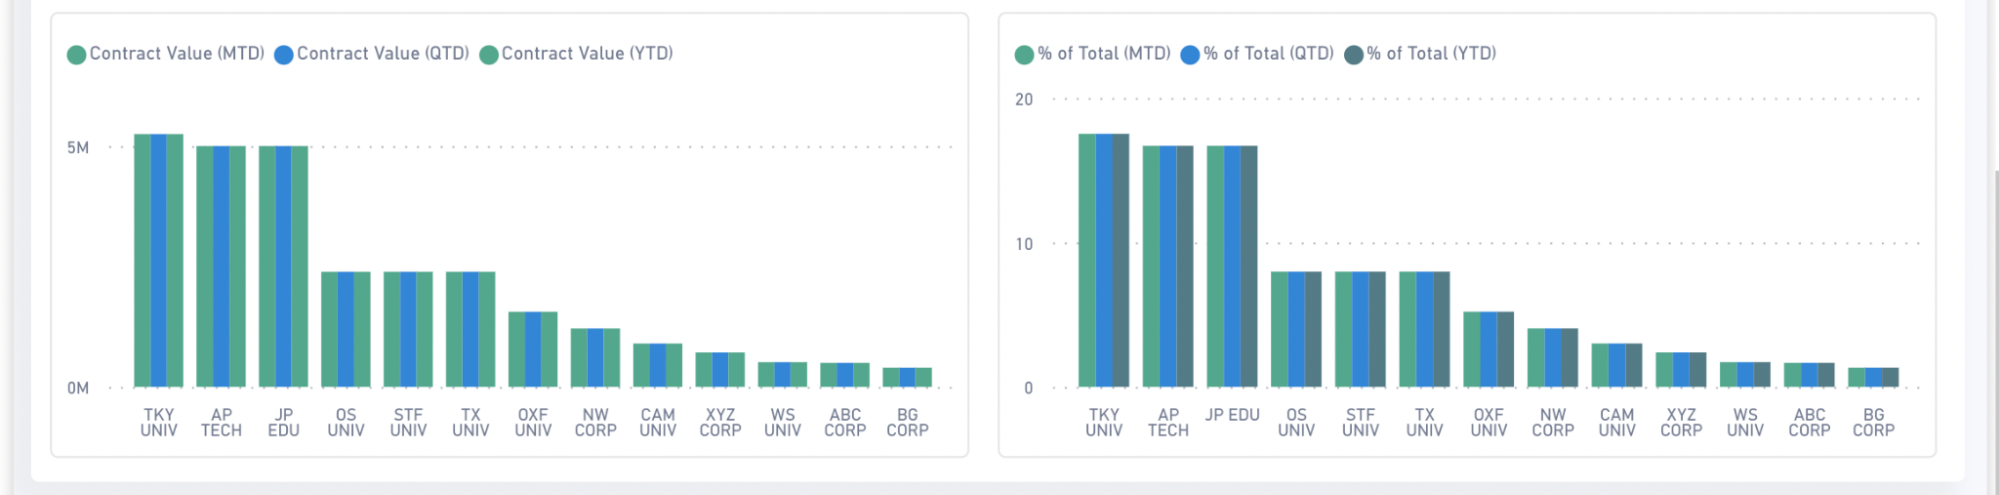
| Top 10 bookings by Customers | A tabular view and a bar chart to present the booking data contributed by the top 10 customers. The booking data includes the actual contract value and the percentage of total bookings by MTD, QTD, and YTD for each of the 10 customers. |
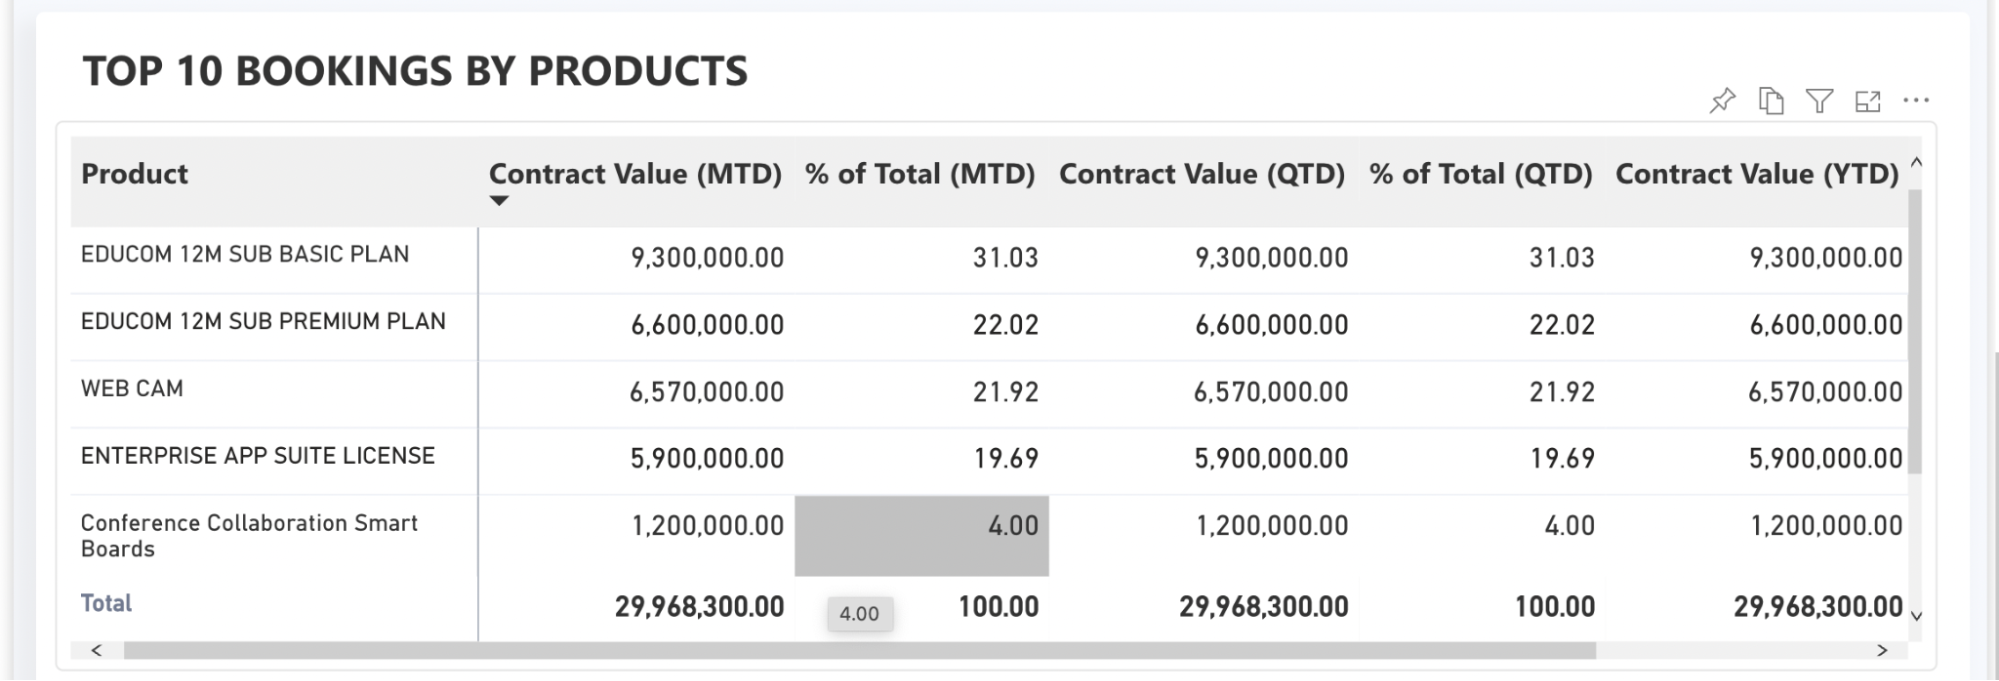
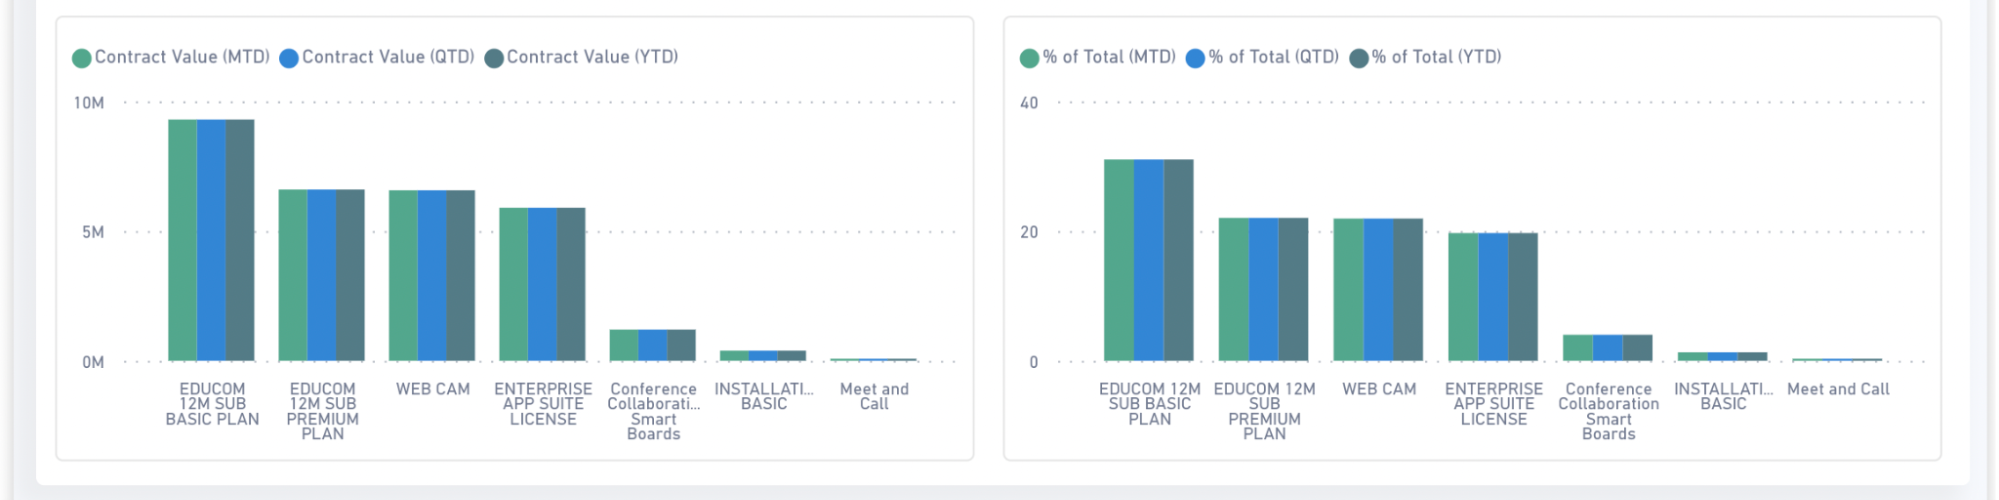
| Top 10 bookings by Products | A tabular view and a bar chart to present the booking data contributed by the top 10 products. The booking data includes the actual contract value and the percentage of total bookings by MTD, QTD, and YTD for each of the 10 products. |
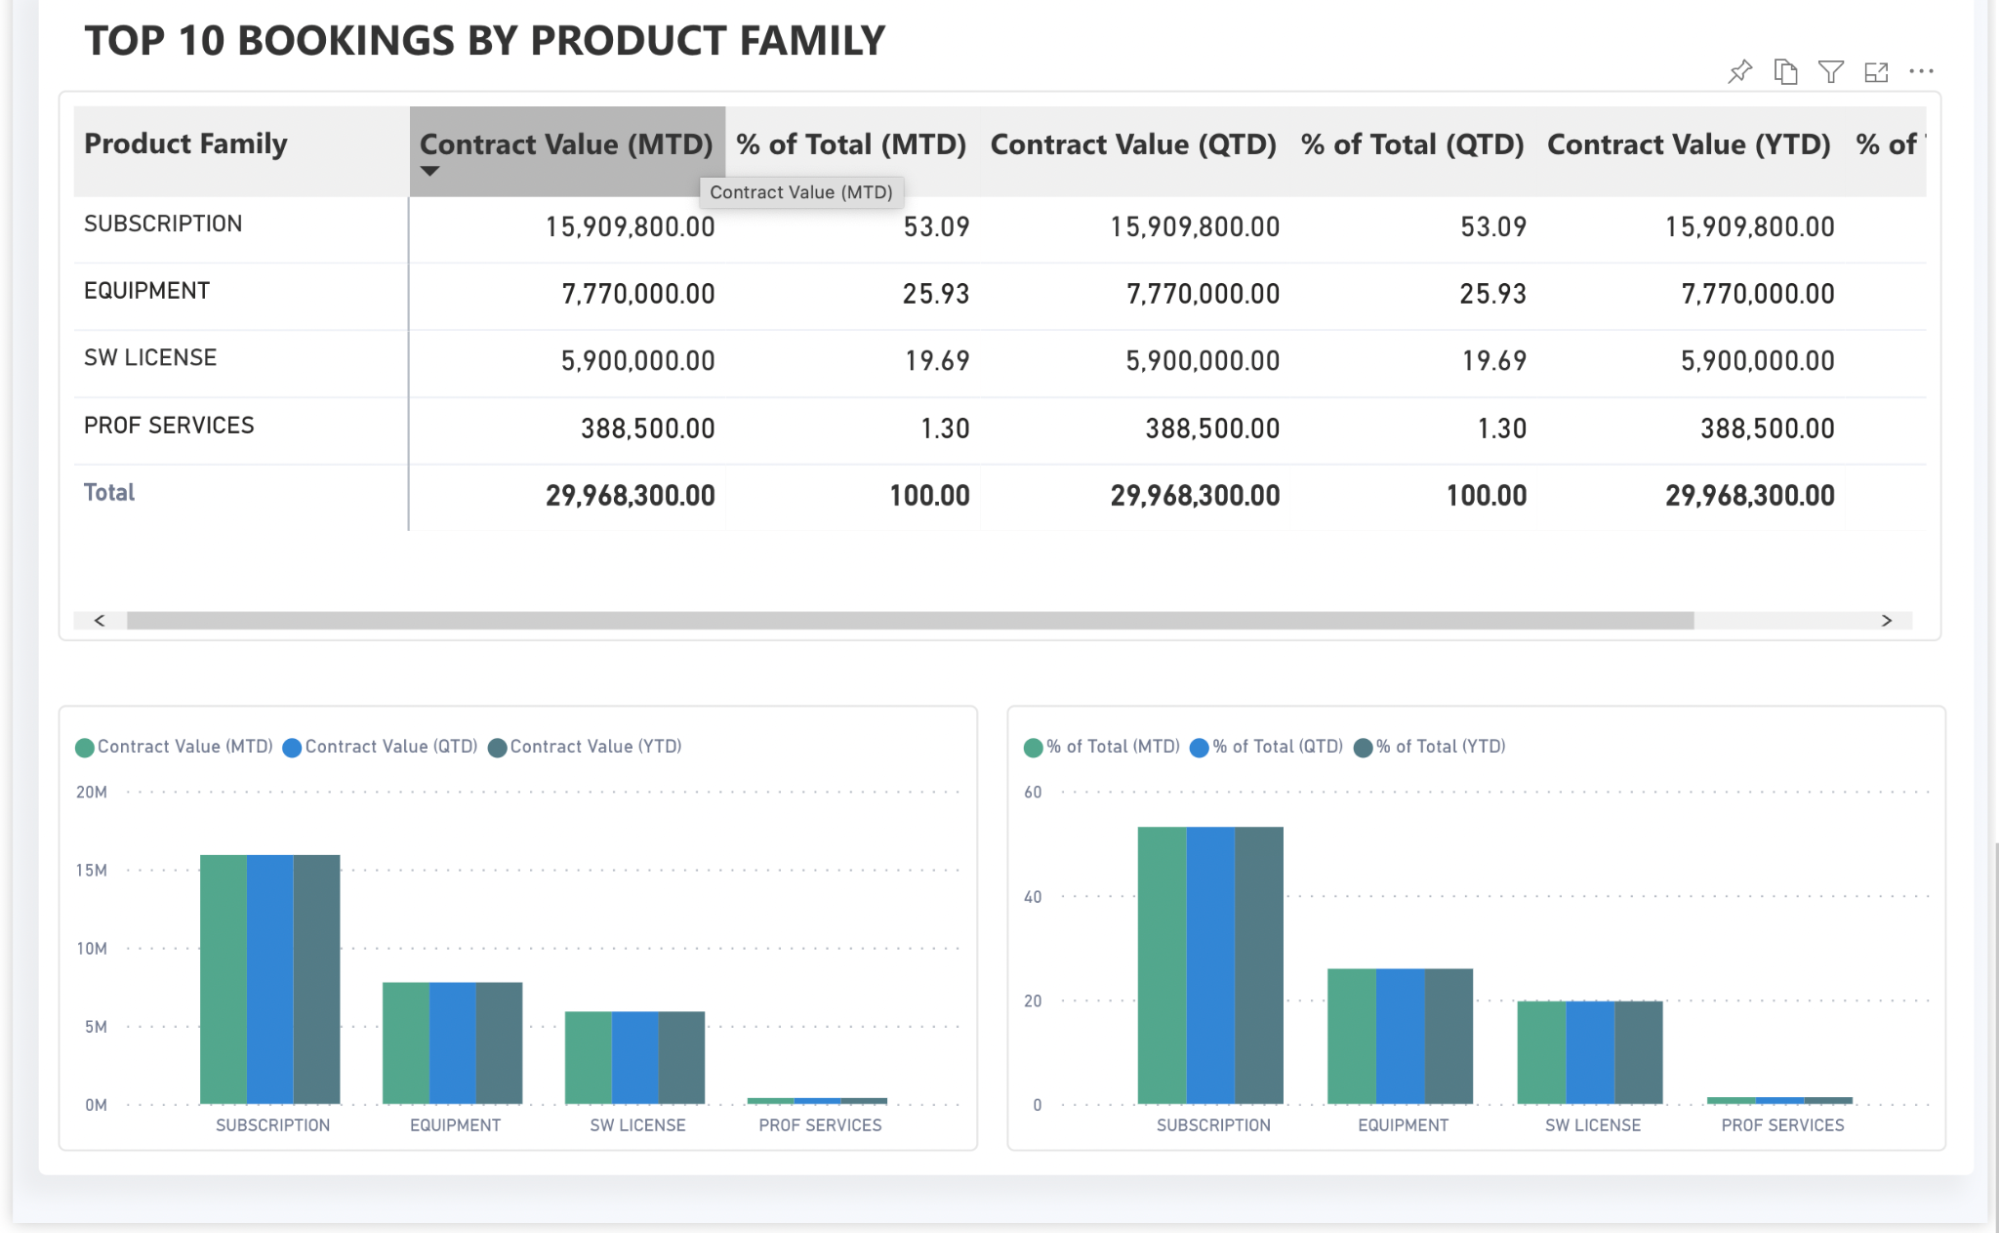
| Top 10 bookings by Product Family | A tabular view and a bar chart to present the booking data contributed by the top 10 product families. The booking data includes the actual contract value and the percentage of total bookings by MTD, QTD, and YTD for each of the 10 product families. |
Forecast tab
The Forecast tab displays the expected or forecasted future revenues.
The following cards are available in this tab. Selecting a data point on any of the cards will automatically filter all other cards as well.
| Card name | Description |
|---|---|
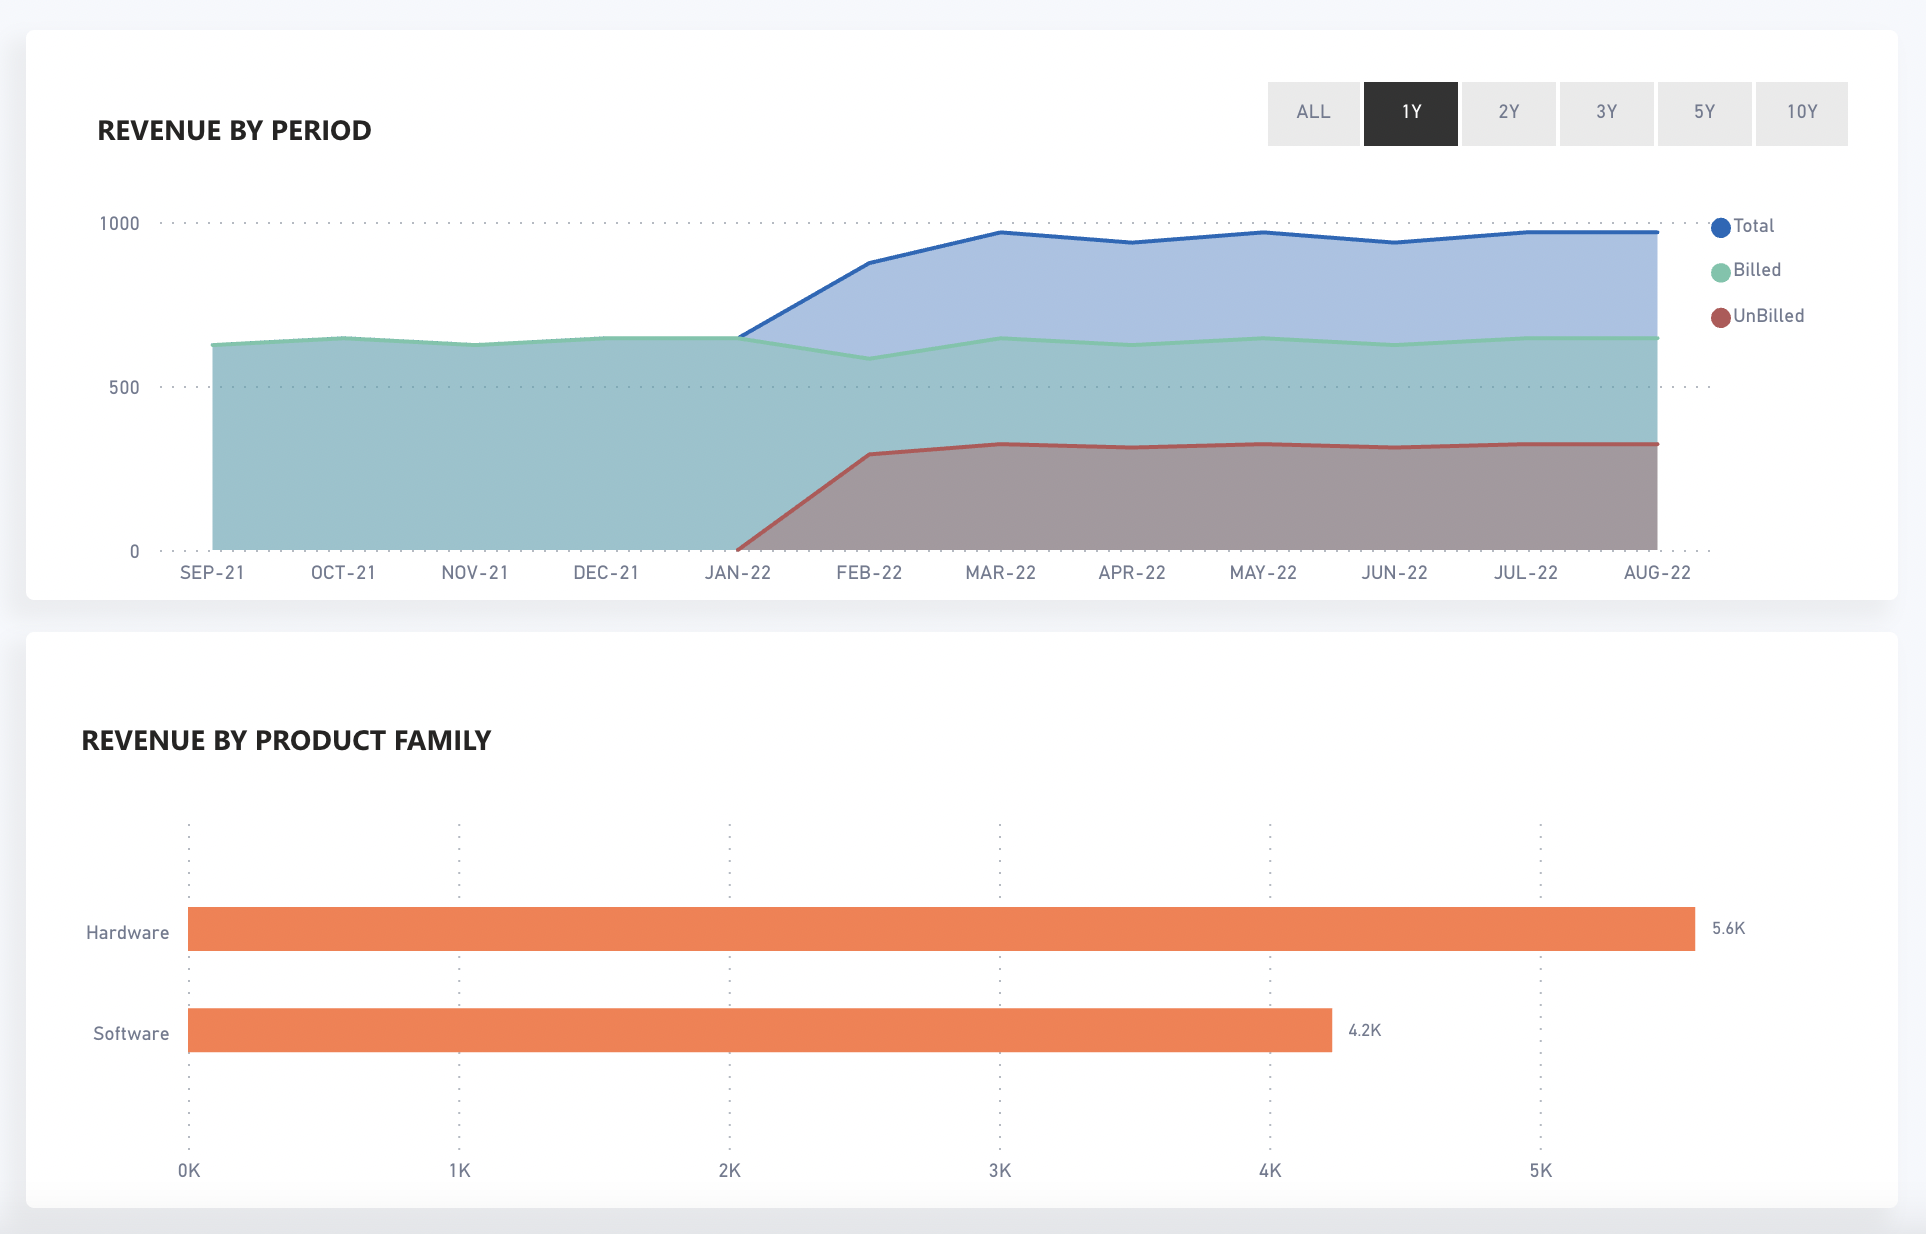
| Revenue by Period | A filled line graph view that presents the total, billed, and unbilled revenue projections for the selected period. You can choose a period of 1 to 10 years or UTD. |
| Revenue by Product Family | A horizontal bar chart that presents the revenue projections based on the product family. |
Historical tab
The Historical tab displays the revenue trends and bookings trends based on the applied filters.
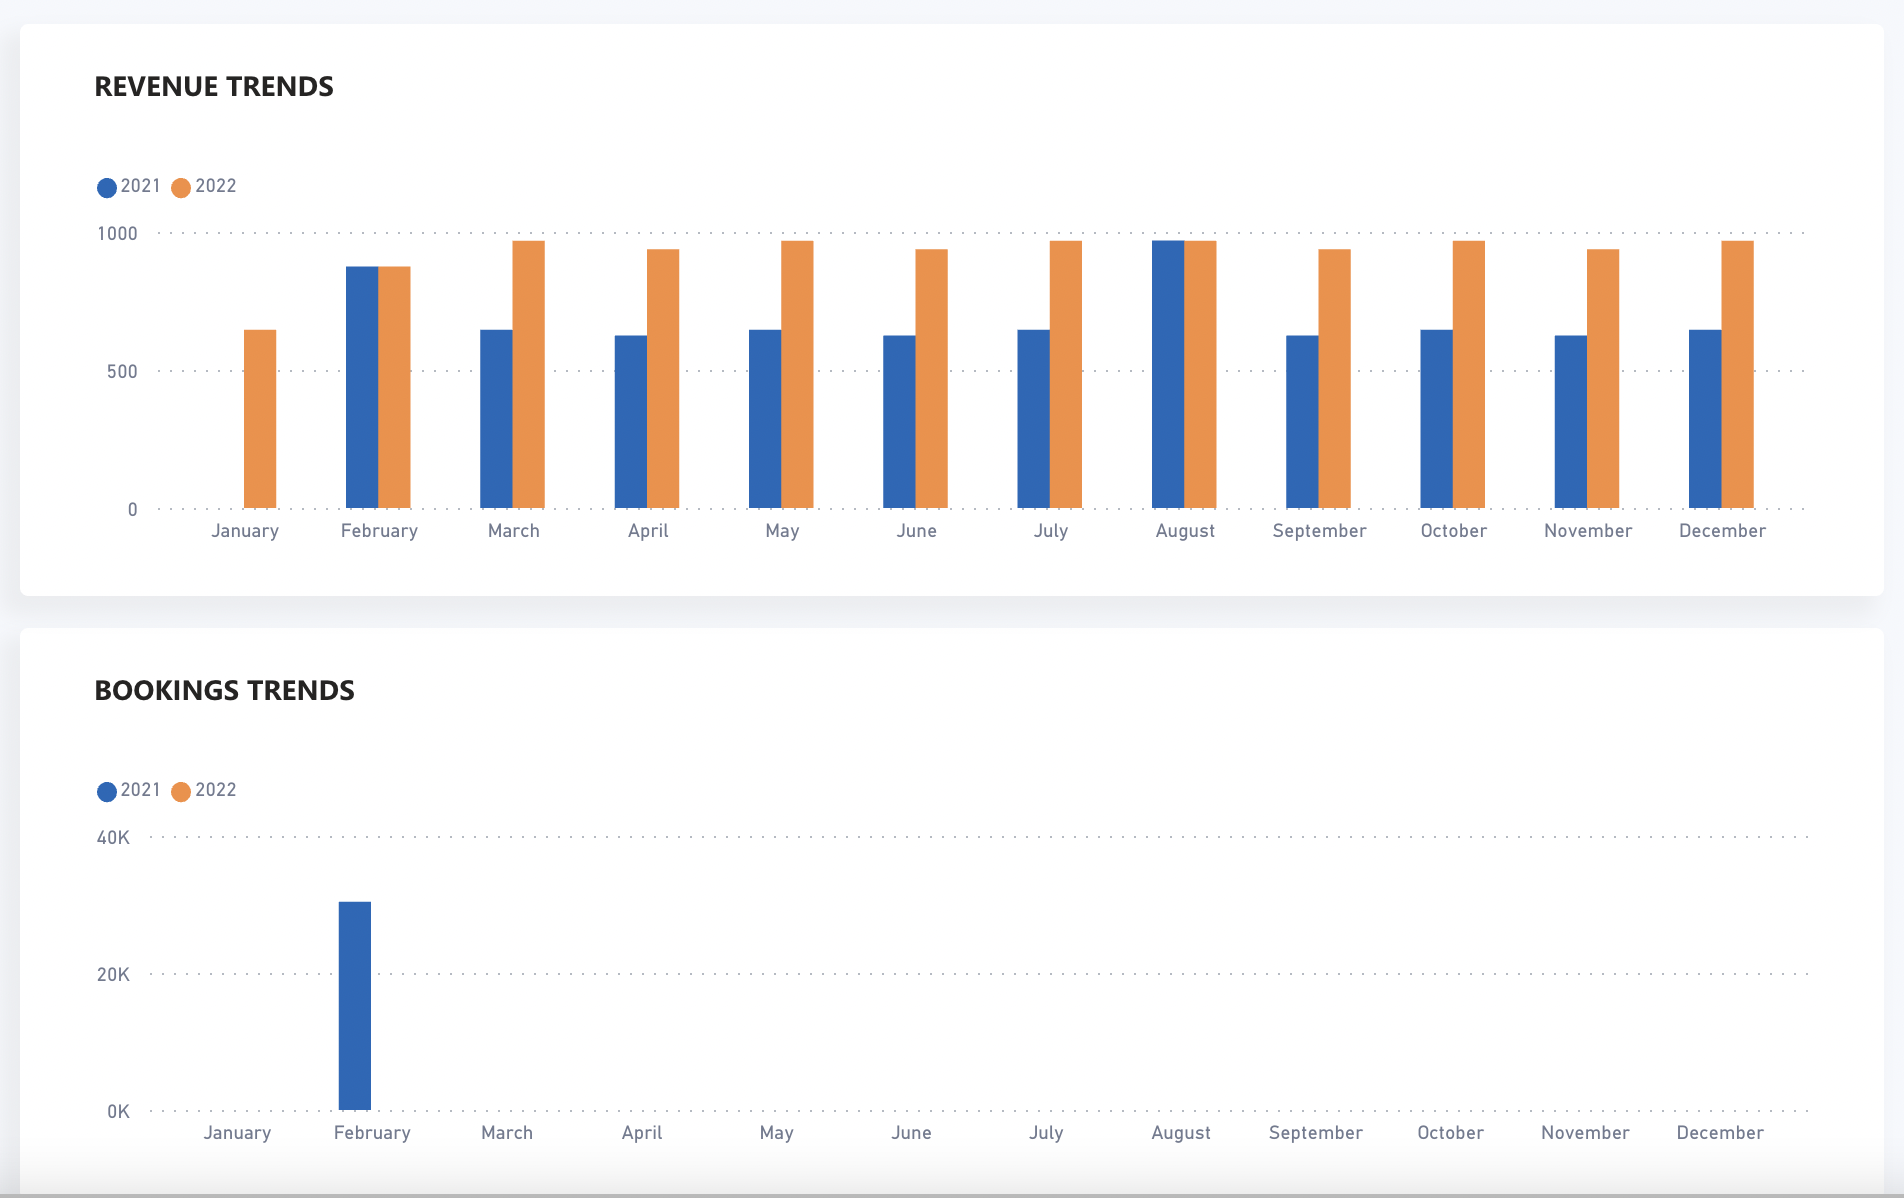
The historical tab displays the following cards. Selecting a data point on any of the cards will automatically filter all other cards as well.
| Card name | Description |
|---|---|
| Revenue Trends | A vertical bar chart that presents a comparison result of the past period revenue as per applied filters. This chart represents the revenue over time and different colors on the bars denote the month that the bar is representing. |
| Booking Trends | A vertical bar chart that presents a comparison result of the past period booking as per applied filters. This chart represents the bookings over time and different colors on the bars denote the month that the bar is representing. |
Filters in dashboard
You can apply one or more filters on the Analytics dashboard to interact with the report for data analysis. The Filters pane appears on the right side of the dashboard, which you can collapse and expand.
You have various options to filter the data of a dashboard. The filtering options allow you to filter data for the specific time period, organizations, currency types, and so on. You can also filter by selecting a data point on a card. Remember that the filters that you have specified for a card or a whole dashboard will not be persisted. The next time you visit this dashboard, the default data will be displayed. You can also refresh the page to reset and display the default data or use the erase option. You cannot create or add any custom filters to this dashboard.
| Filters | Description |
|---|---|
| Search | Enables you to search for filters by specifying the keywords. |
| Filters on this visual | The visual-level filters are the ones that are activated when you click a graph view. When you select a data point on a card, it turns into a filter condition. This filter will be applied to all the cards in the current tab. |
| Filters on this page | The page-level filters are the ones that are specific to the selected tab only. The filter options vary for each tab. |
| Filters on all pages | The report-level filters are the ones that are commonly available for all tabs of the dashboard. |