Zuora Benchmark Metrics
Zuora In-product Benchmark metrics are represented as boxplots.
A boxplot is a visual representation of the distribution of a data set based on four data points including the minimum, first quartile, median, third quartile, and maximum.
Let’s consider the following example for interpretation:
Here, the dotted line inside the box represents the median. Edges of the square show the 25th and 75th percentiles.
Standard Benchmark Metrics
By default, you will have access to all the standard metrics explained in the following table.
|
Metric |
Description |
How to interpret |
Insights |
|---|---|---|---|
|
Annual Pricing Updates |
Measures the percentage of active rate plans created in the last year. |
A higher percentage indicates a proactive approach to pricing strategy. |
Update your rate plans periodically to stay competitive. |
|
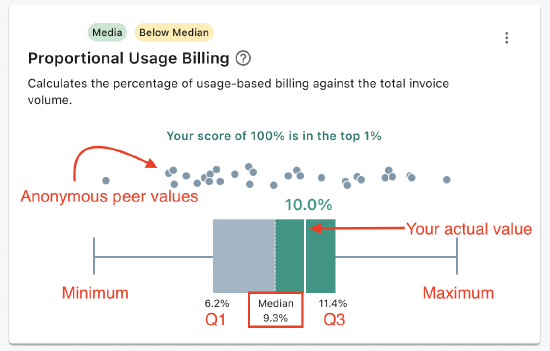
Proportional Usage Billing |
Calculates the percentage of usage-based billing against the total invoice volume. |
A higher ratio suggests more revenue from usage-based services. |
Evaluate your pricing model to ensure it aligns with your business goals. |
|
Subscriber Flexibility Index |
Represents the average number of subscription changes per active subscription, excluding renewals and churns. |
More flexibility generally correlates with higher growth. |
Consider simplifying your subscription amendment process. |
|
Automated Billing Efficiency |
Indicates the ratio of invoices generated per billing run. |
A higher ratio reflects more efficient billing operations. |
Look into automating more aspects of your billing process if this metric is low. |
|
Quick Payment Rate |
Displays the percentage of invoices paid within 90 days. |
A higher rate signifies efficient payment operations. |
If your payment rate is low, review your invoicing and collection practices. |
|
e-Payment Success Rate |
Measures the percentage of successful electronic payments against all attempts. |
A higher success rate is indicative of seamless payment processing. |
Investigate and rectify frequent payment failures to improve this metric. |
|
Speed to Close Books |
Shows the average number of days to close accounting periods. |
Fewer days suggest more efficient financial operations. |
Look for bottlenecks in your closing process if this number is high. |