Waterfall calculation
The following waterfall tables are provided as examples to help you better understand the calculations done in the waterfall. Different actual and forecast schedules are presented based on different percentages of released revenue in a revenue contract.
In the example, there are two sales order lines in the revenue contract. The revenue start date is 01-May-2019 and the revenue end date is 31-Aug-2019. In the forecast template definition, Revenue Start Date is selected for Forecast Start Date and Prorate is the adjustment method.
In the Workbench, the following filter is applied to generate waterfall at the transaction level.

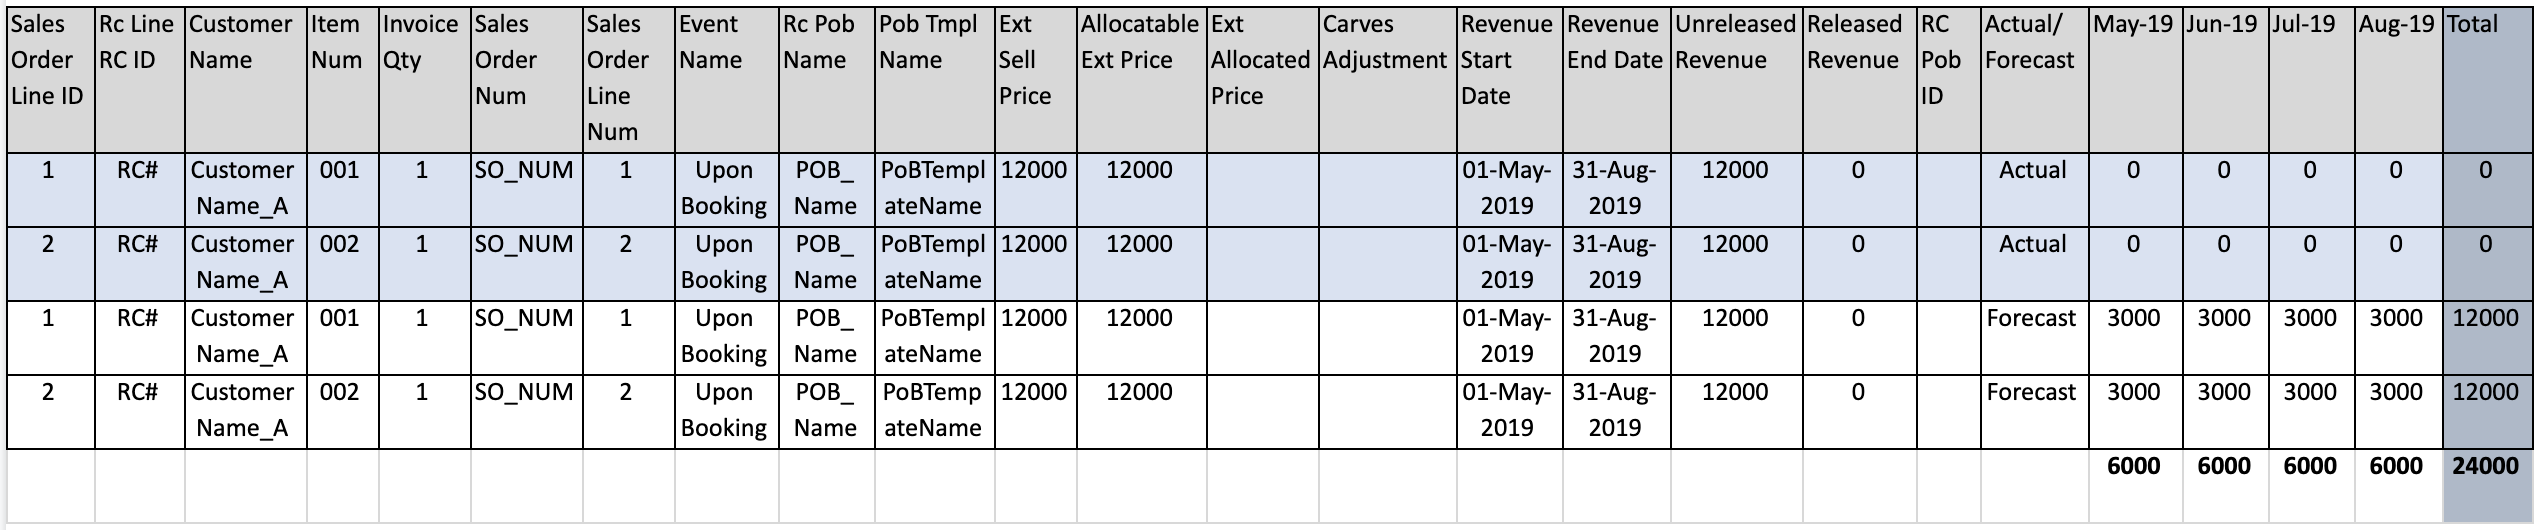
When the revenue has not been released (Revenue Released PCT = 0%), the following waterfall data is generated:
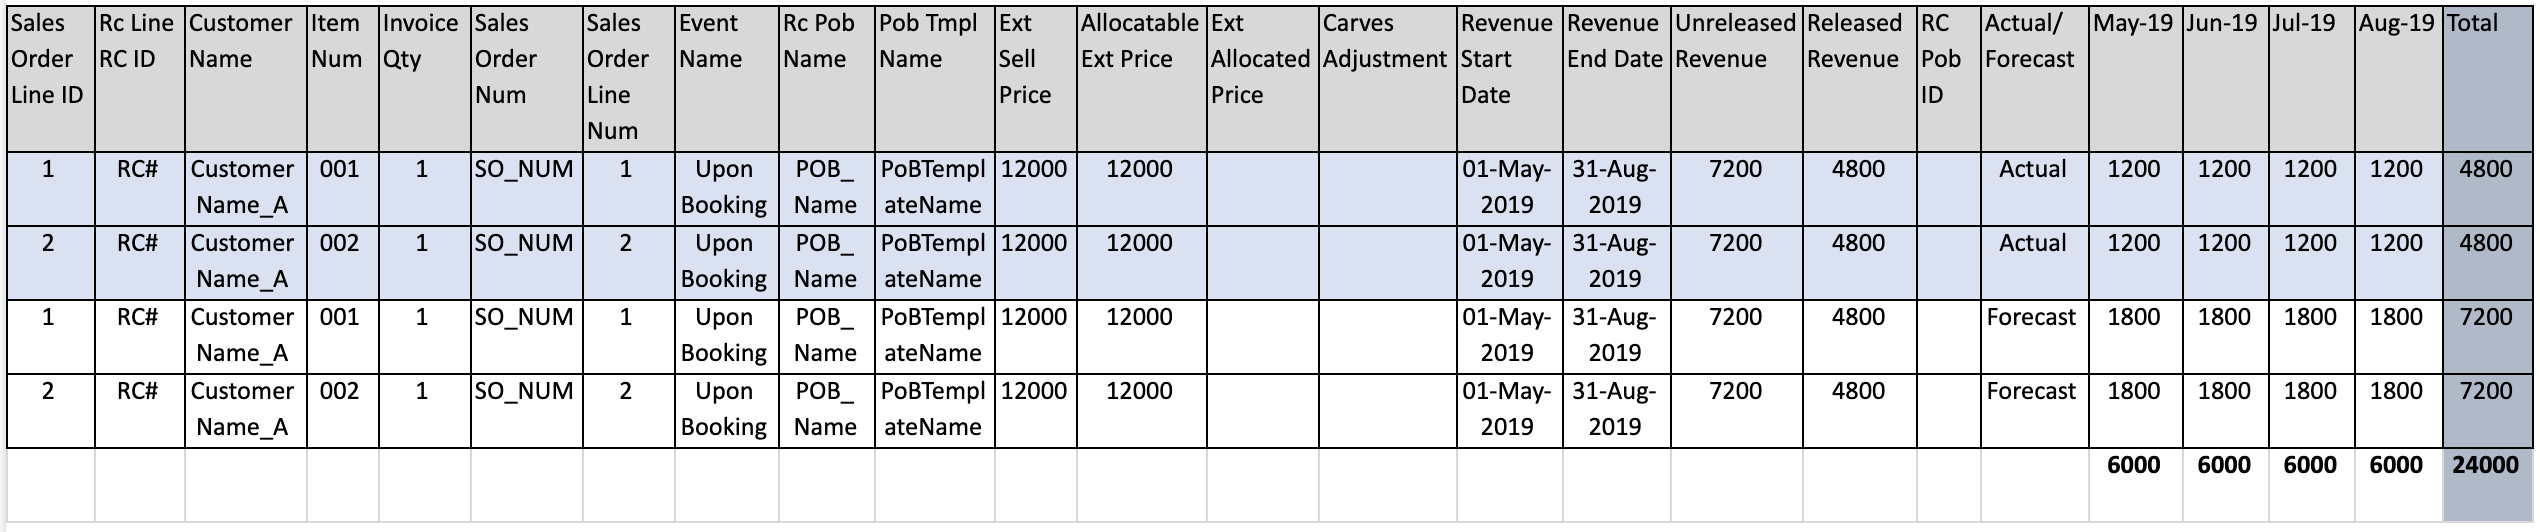
When the revenue is partially released (Revenue Released PCT = 40%), the waterfall data is as follows:
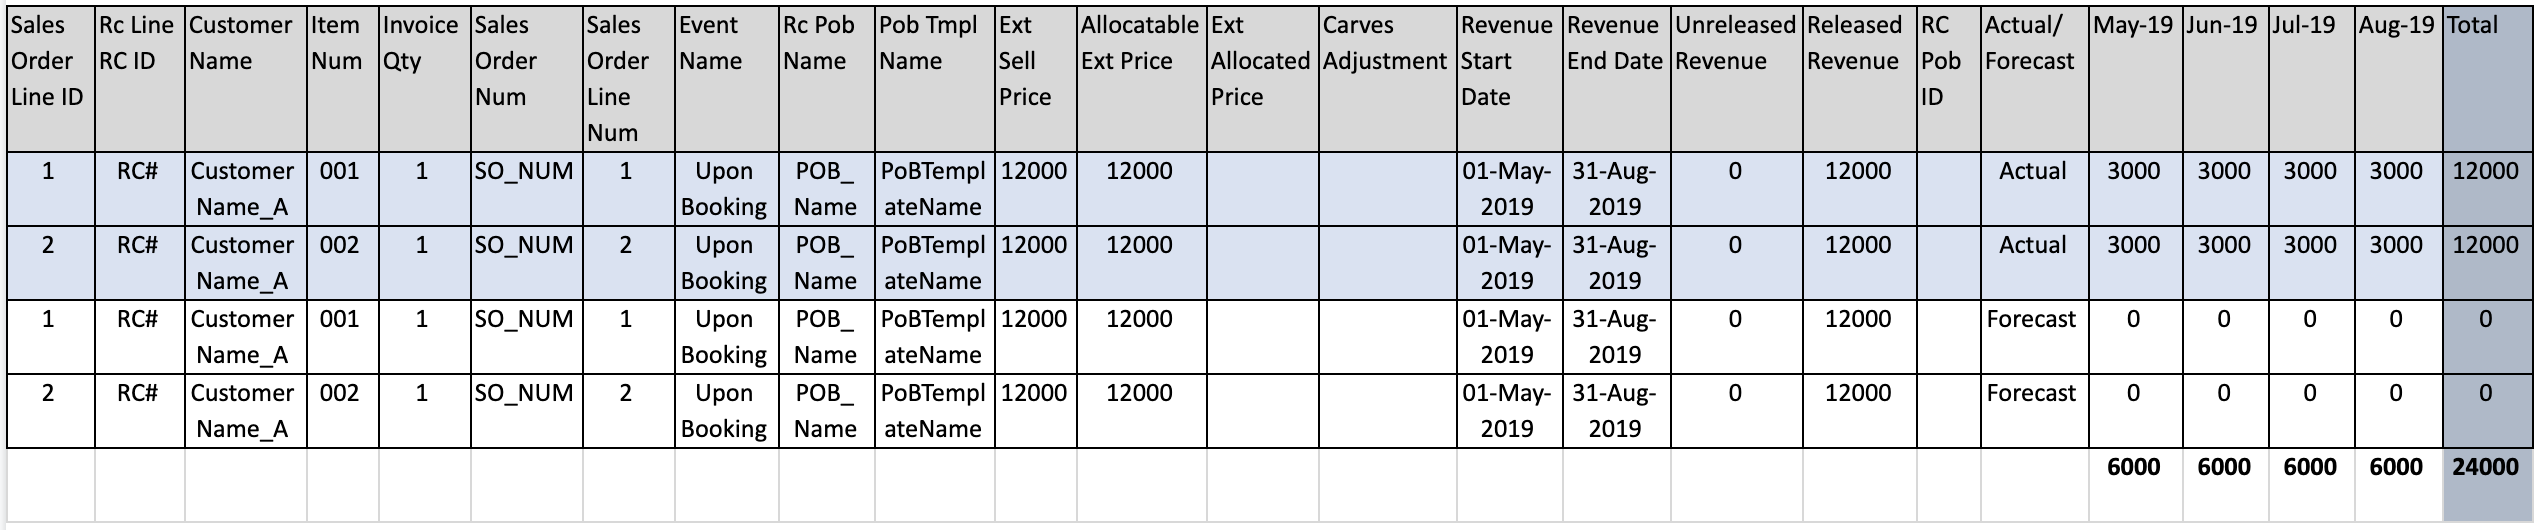
When the revenue is all released (Revenue Released PCT = 100%), the following waterfall data is generated:
All the above waterfall tables can also be downloaded in the attached CSV file for your reference.