Close Process dashboard
Use the Close Process dashboard to get a high-level understanding of financial data for the current open period and to identify the data problems and take appropriate actions early.
Close Process dashboard is still under active development for improved performance and enhanced capabilities. For changes that are introduced but not directly visible on the dashboard itself, see Product changes made for Close Process dashboard.
Prerequisite
To access the Close Process dashboard, make sure the following requirements are met in Zuora Revenue:
- Zuora unified authentication (Zuora SSO) is enabled for the Zuora Revenue tenant.
- To use this dashboard, the following profiles must be appropriately configured. Navigate to Setups > Application > Profiles to examine or edit the value of this profile.
- ENABLE_CLOSE_PROCESS_DASHBOARD: Enable this profile for the Close Process option to show up under the Dashboard section on the main menu.
- ENABLE_CLOSE_PROCESS_API: Enable this profile to activate the dashboard. To verify the current status of the dashboard, navigate to Dashboard > Close Process from the main menu and check the status label next to the period label. The label can take one of the following values:
- Active: Indicates the dashboard is enabled.
- Disabled: Indicates the dashboard is disabled.
- ENABLE_ACCT_ANALYSIS_DASHBOARD: Enable this profile to view the Accounting Analysis, Trends Analysis, and Trial Balance tabs on the dashboard.
- REAL_TIME_SUMM_BY_RCS: Enable this profile for the Accounting Analysis, Trends Analysis, and Trial Balance tabs to display the real-time accounting data.
Before you enable the REAL_TIME_SUMM_BY_RCS profile, manually start a one-off RevPro3.0 Reporting Summarize Current Period program for summarization on all revenue contracts, events, and actions to keep the reporting data up to date.
If you have multiple organizations configured in Zuora Revenue, run the RevPro3.0 Reporting Summarize Current Period for Multi-Org program for the same purpose.
After that, you no longer need to run the RevPro3.0 Reporting Summarize Current Period or RevPro3.0 Reporting Summarize Current Period for Multi-Org program. Zuora Revenue will summarize data for reporting and dashboards in real time.
- CALL_FREE_UNUSED_MEMORY: Set this profile to Yes.
- The current user role has appropriate access to this dashboard or specific tabs on this dashboard. The role privileges are usually configured by the system administrator on the Setups/Security/Roles page.
Overview
The Close Process dashboard contains multiple tabs that help you to identify problems across the major phases within the month-end process. The Data Validation tab is for the upstream data validation phase, and the Accounting Analysis tab is for the accounting reconciliation phase. The Trend Analysis tab provides you with insight into the activities that cause changes to the planned revenue as of the prior period close in Zuora Revenue waterfall. The Trial Balance tab provides you with a real-time view of the general ledger (GL) account activity and balance that is maintained in Zuora Revenue. The sections below provide details about the data presented in each tab.
Data Validation
Use the Data Validation tab to see whether there are upstream data issues for the current period. Whenever there is an error or warning reported on this tab, use the VIEW column to find the summary of the validation issue and the appropriate actions you can take to fix the data issues.
| Item name | Description |
|---|---|
| Data Readiness Exceptions |
This item is applicable only to Billing - Revenue Integration environments. Represents the transaction lines that failed to be synced from Zuora Billing to Zuora Revenue during the Revenue Sync process. Click Summary in the VIEW column to view the number of transactions that are identified and stamped with corresponding error messages. Click Details to view more information about each transaction, such as transaction type in Zuora Revenue, subscription name and version, charge number, charge segment, charge model, extended sell price, revenue start and end dates, and so on. |
| Impairment Accounting Exceptions |
Represents the validation errors that are caused by contract impairment. When a revenue contract is canceled for a partial term (reduced term), there might be unposted adjustment revenue pertaining to the canceled future term. In this case, the system will rely on the Impairment Type flag to determine how to handle the impairment amount of adjustment revenue. If the Impairment Type flag is not defined appropriately, it will be reported as a contract impairment exception. Click Summary to see the number of affected transaction lines, unreleased adjustments, and error messages. Click Details to get more information about the transaction lines, such as contract ID, sales order number, extended sell price, etc. You can also take appropriate action to fix the impairment exception from there. |
| Line Stage Exceptions |
Represents the transaction lines (including orders and billing lines) from the upstream systems that are impacted by data validation errors. These records are applicable for the current open period based on the RC Line Created Date field. Click Summary in the VIEW column to view the number of transaction lines that are stamped with individual error messages. Click Details to open the Error Transactions page to find the line-level details of the exceptions or errors. |
| Unprocessed Events | Represents the number of event records, such as revenue release events, which are not processed yet in the current open period based on the Event Effective Date field. |
| Orphan Transactions |
Represents transaction lines that are delinked from existing revenue contracts. Click Summary in the VIEW column to view the number of orphan transaction lines. Click Details to open the Orphan Transactions page to review the impacted records at the POB, line, or revenue contract level. |
| Revenue Holds |
Displays the number of revenue holds that are applied and need assessment to be released. You must review these holds and take appropriate actions. Click Summary in the VIEW column to the revenue value that is impacted by manual holds and by system-applied holds. Click Details to open the Holds page in Workbench where you can review the impacted records at the POB, line, or revenue contract level to take appropriate actions. |
| SSP Exceptions |
Represents the sales order (SO) lines for which the fair value (also known as standalone selling price) cannot be derived based on fair value information that is available in Zuora Revenue. The allocation and adjustment revenue calculation will be impacted for the SO lines and their revenue contracts. Click Summary in the VIEW column to view the number of SO lines that are impacted and the total Extended Sell Price. Click Details to open the SSP Exceptions page to review and take action on the impacted SO lines. |
| Auto POB |
Indicates whether there are transaction lines to which the Auto POB template is applied. These transaction lines must be assigned a valid POB template for further revenue processing. Click Summary in the VIEW column to view the number of SO lines that are impacted and the total Extended Sell Price. Click Details to open the AUTO POB page to review the line-level details and assign the appropriate POB to the SO lines. |
| Unreleased POB |
Click Summary to view the number of POB lines that have unreleased revenue in the following circumstances. It provides a breakdown of the number of POB lines and total unreleased amounts for each circumstance. If required, you might have to manually release the revenue on these lines.
Click Details to open the Unreleased POB page to review the line-level details and navigate to the RC Workbench or Events to take the relevant actions. |
| Journal Entries |
Indicate the status of journal entries in various stages of completion. Click Summary to see the breakdown of the numbers of journal entries in different statuses. Click Details to go to the Manual Journals page to review the pending journals and take appropriate action. |
| Overstated Orders |
Represents the sales orders (SO) lines with a net sell price greater than the net billing amount. Click Summary in the VIEW column to see the number of impacted revenue contracts, the number of sales order lines, and the total overstated amount (in Reporting currency), which are summarized based on different upstream systems. Click Details to get a list of SO line ID, RC ID, and relavant SO attributes from where you can link to Revenue Workbench by clicking the RC ID or SO line ID. To exclude SO lines with overstated amount from being reported as exceptions, edit the POB template to toggle the Exclude from Close Dashboard switch to Yes. |
Accounting Analysis
Zuora Revenue provides the Accounting Analysis tab to automate the common reconciliations steps within the revenue close process. In this tab, any entries that are not available for posting within the period will be identified as the variance. Revenue users can review the variance in real-time and take action as needed.
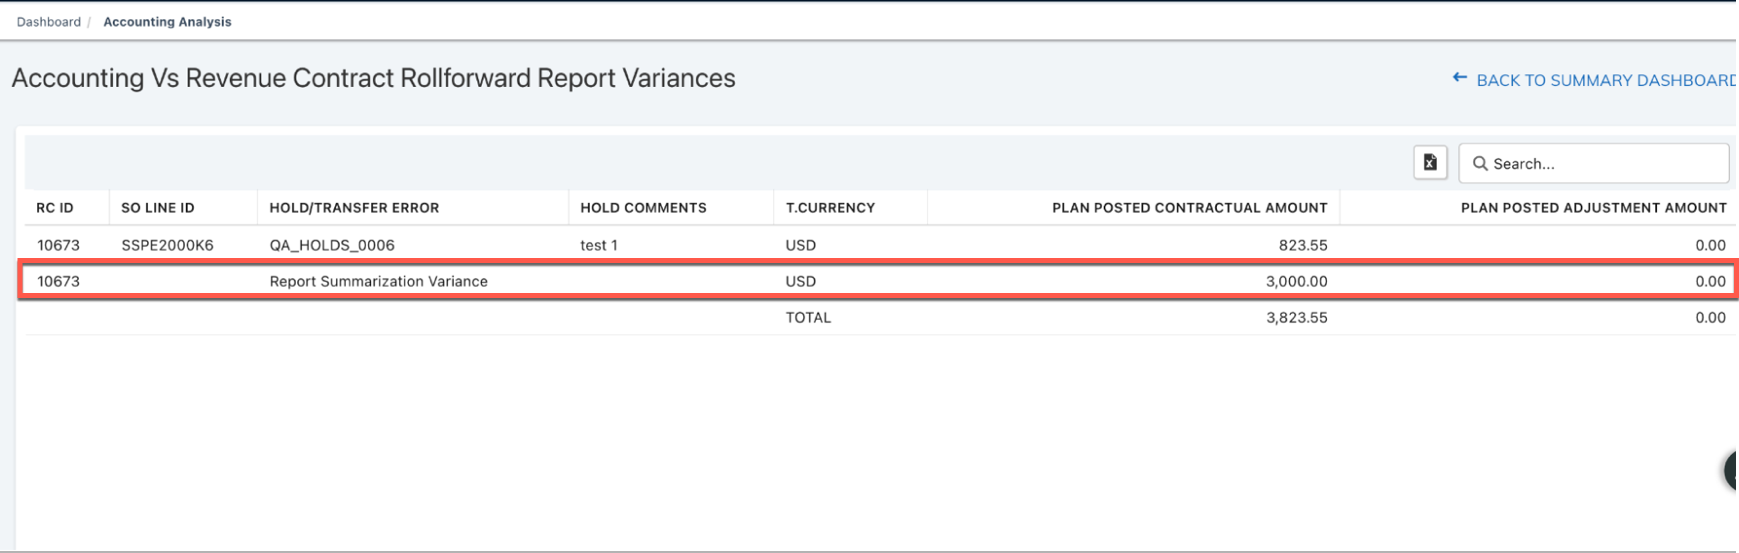
To get the details about the corresponding revenue contracts, simply click the variance amount in each table. The CONSOLIDATED VARIANCES link on the top right corner of each table also provides a breakdown of the variance amount by the entity and by the account segment. It is recommended to check this tab and reconcile the reports on a regular basis throughout the period, which can help reduce period-end processing time.
37.012.00.00 onwards, the variances drill-down will show differences between Accounting Schedules and Reporting tables due to summarization errors at an RC level.
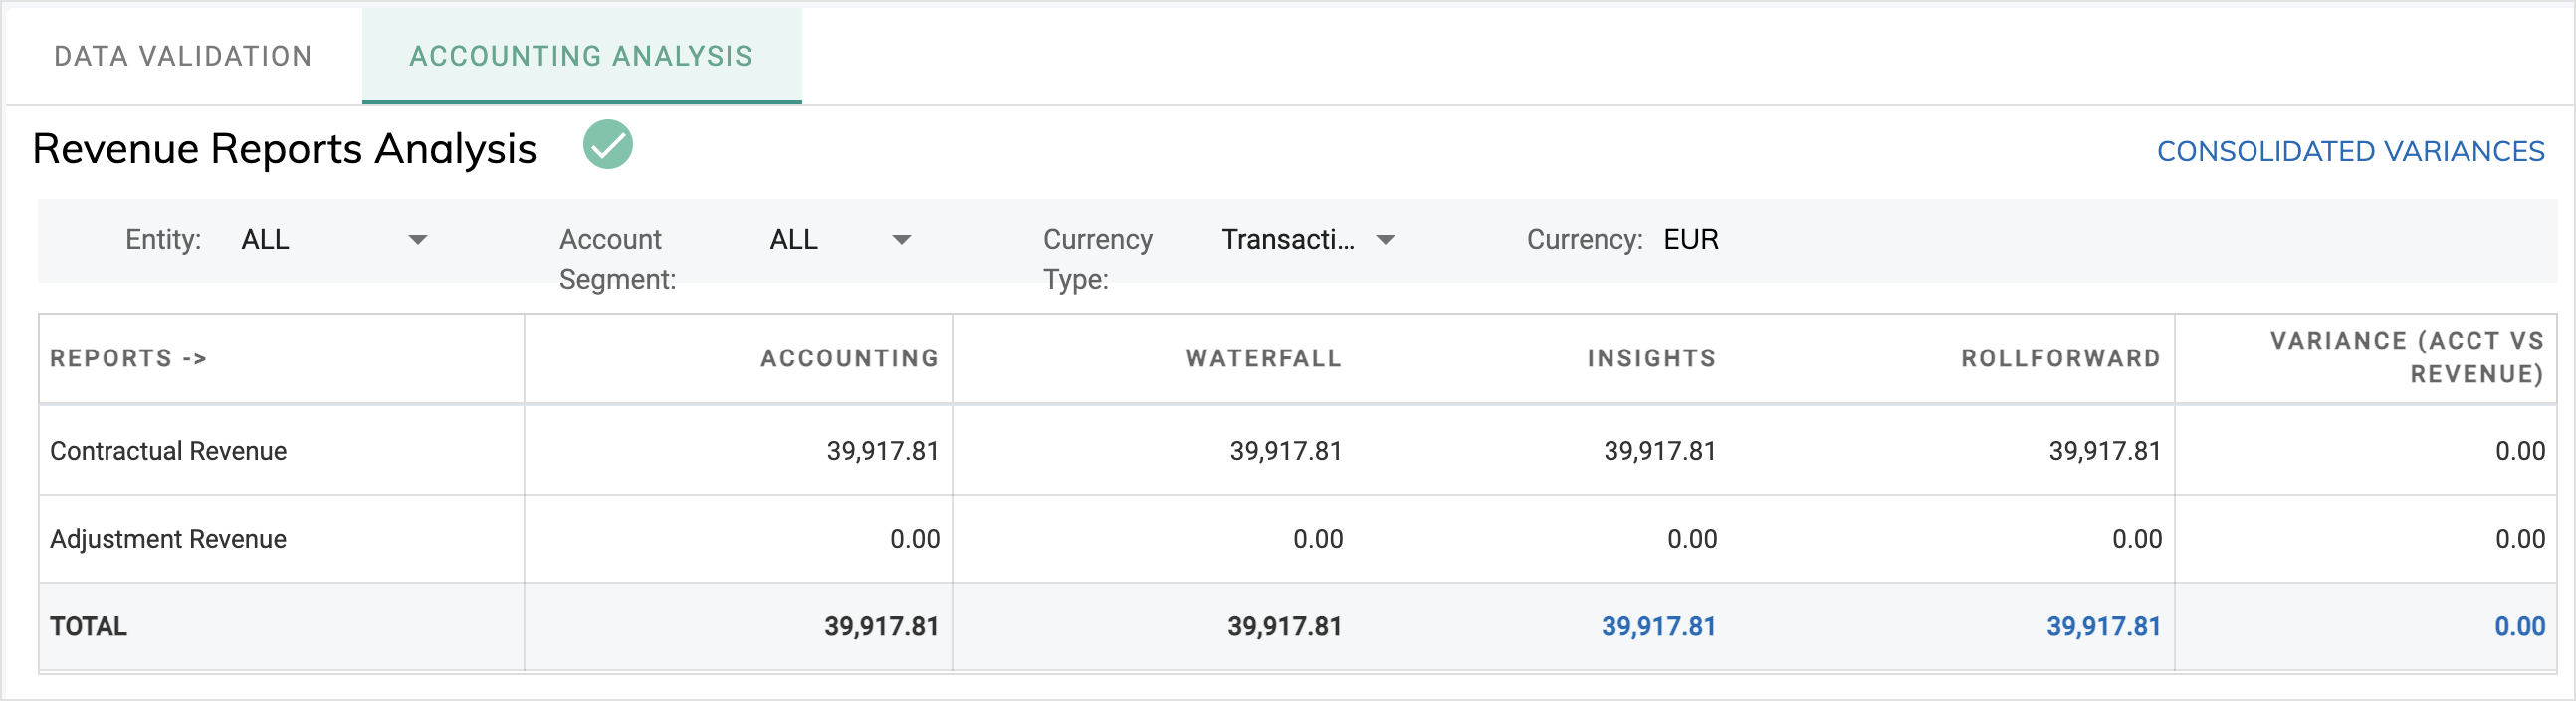
Revenue Report Analysis
This table represents the summary level of the Revenue Insight Report, Waterfall Report, and activities in the RC Rollforward and Unbill Rollforward Report for the current period by revenue type. Reconciliations between the Accounting Detail Report and the three reports are also automated in the table to identify any variance.
The reconciliation result is displayed in the Variance column. If the validation passes, $0 is displayed; otherwise, the variance amount is displayed in the table and an exception flag is displayed next to the table name. Click the variance value to open the page for line-level details. When all validations pass, a checkmark is displayed next to the table name.
The data definitions for these reports are explained as follows. All reports are run with the period filter applied for the current open period.
| Report name | Contractual Revenue | Adjustment Revenue | Variable Considerations | MJE |
|---|---|---|---|---|
| Accounting Detail Report |
The sum of the journal entries that were posted/eligible to be posted in the current open period with the following flags:
|
The sum of the journal entries that were posted/eligible to be posted in the current open period with the following flags:
|
The sum of the journal entries that were posted/eligible to be posted in the current open period with the following flags:
|
The sum of the journal entries that were posted/eligible to be posted in the current open period with the following flags:
|
| Revenue Insight Report | The sum of the Rev Activity column with the MJE Flag as N | The sum of the Adjustment Rev column with the MJE Flag as N | The sum of the VC Activity column with the MJE Flag as N | The sum of Ttl Rev Activity column with the MJE Flag as Y |
| Waterfall Report |
The total amount on the current period column in the Waterfall Report (WF Type = Revenue). |
The total amount on the current period column in the Waterfall Report (WF Type = Adjustments). |
The total amount on the current period column in the Waterfall Report (WF Type = VC Contra Revenue). |
The total amount on the current period column in the Waterfall Report with the MJE Flag as Y |
|
Roll forward Reports (RC Roll forward & Unbilled Roll forward Report) |
The sum of the CL Releases column in the RC Rollforward Report (excluding the VC activity) + The Net Unbilled Revenue Activity (for lines with Right to Bill = Y) where, The Net Unbilled Revenue = Sum of the Unbilled Revenue - Unbilled Billing columns in the Unbilled Roll forward Report (for lines with Right to Bill = Y) |
The sum of the Alloc Releases column in the RC Rollforward Report with the period filter applied for the current open period. | The sum of the CL Releases column in the RC Rollforward Report (VC activity) | The sum of the Releases column in the RC Rollforward Report with the MJE Flag as Y |
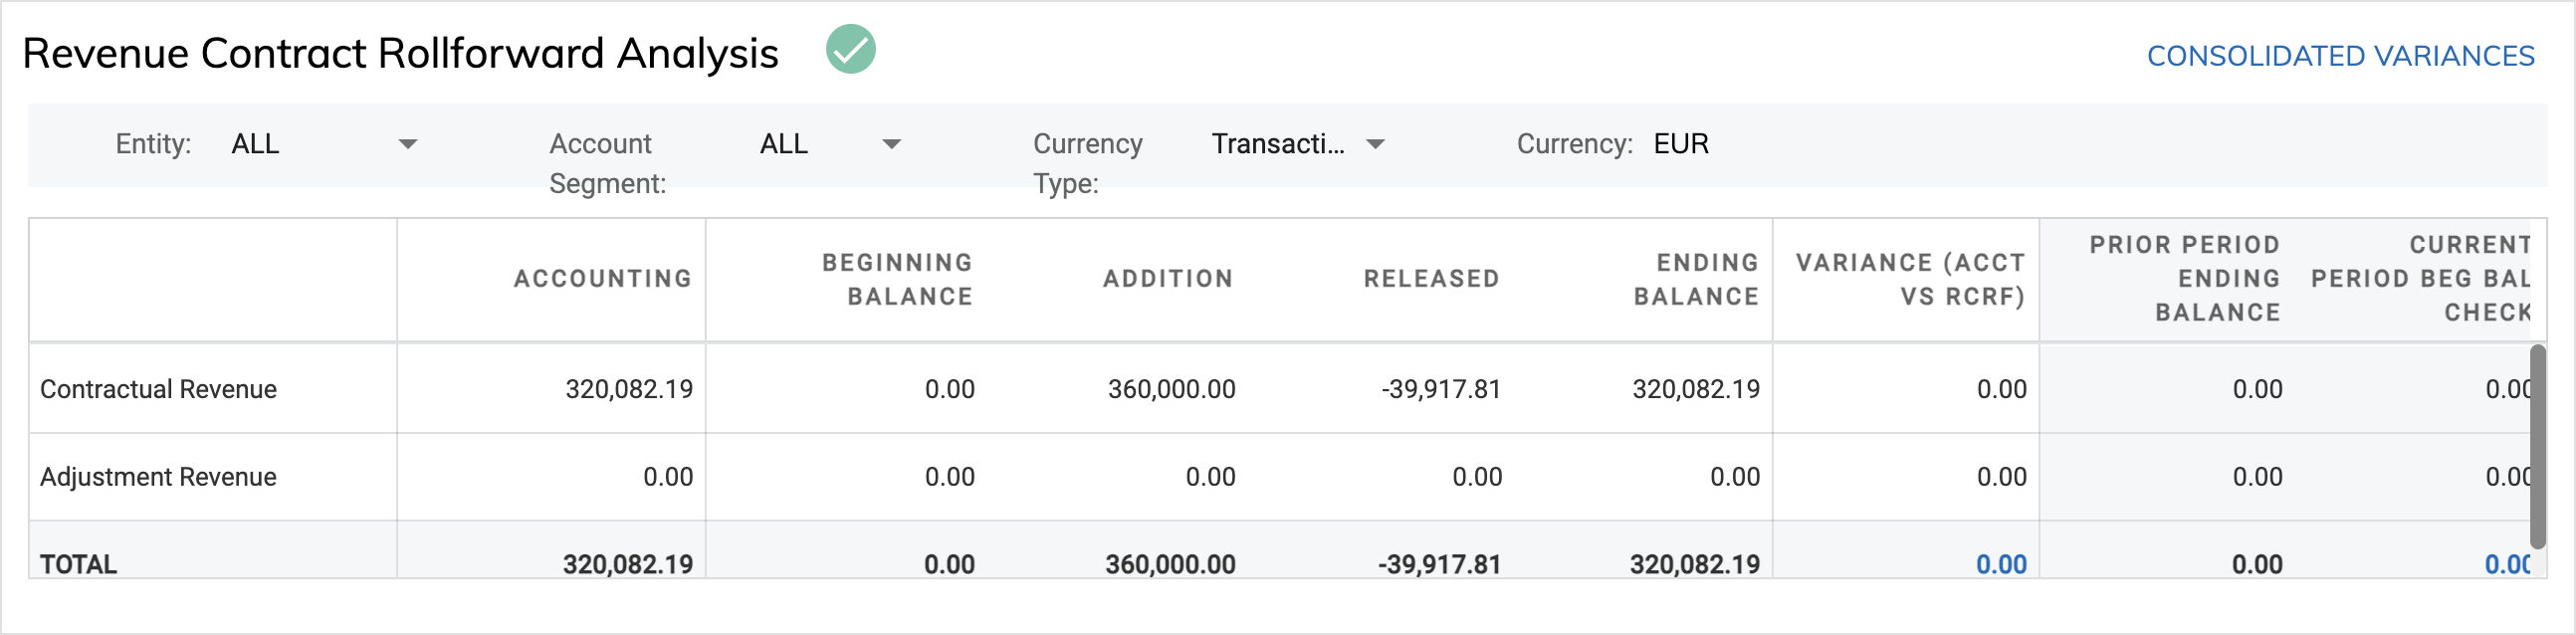
Revenue Contract Rollforward Analysis
This table represents the summary level of the RC Rollforward Report for the current period by revenue type. The following reconciliation steps required by the close process are automated to identify any variances:
- Accounting Details Report = Current period activities (Addition + Released)
- Current Open Period Beginning Balance = Prior Period Ending Balance
The reconciliation result is displayed in the Variance column. If the validation passes, $0 is displayed; otherwise, the variance amount is displayed in the table and an exception flag is displayed next to the table name. When all validations pass, a checkmark is displayed next to the table name.
The data definitions for these reports are explained as follows. Reports are run with the period filter applied for the current open period.
| Report name | Contractual revenue | Adjustment revenue | VC Revenue | Journal Entries (JE) |
|---|---|---|---|---|
| Accounting Detail Report |
The sum of journal entries that were posted and will be posted in the current open period with the following flags:
|
The sum of journal entries that were posted and will be posted in the current open period with the following flags:
|
The sum of journal entries that were posted and will be posted in the current open period with the following flags:
|
The sum of journal entries that were posted and will be posted in the current open period with the following flags:
|
| RC Rollforward Report |
For lines with the MJE Flag as N or Null:
VC activity and balances are excluded, which are displayed in a separate row. |
For lines with the MJE Flag as N or Null:
|
The amount of VC activity and balances that are included in the Contract Liability (CL) activity and balances in the report. Note: The current report will display the CL columns including the VC activity and balances. |
For lines with the MJE Flag as Y:
|
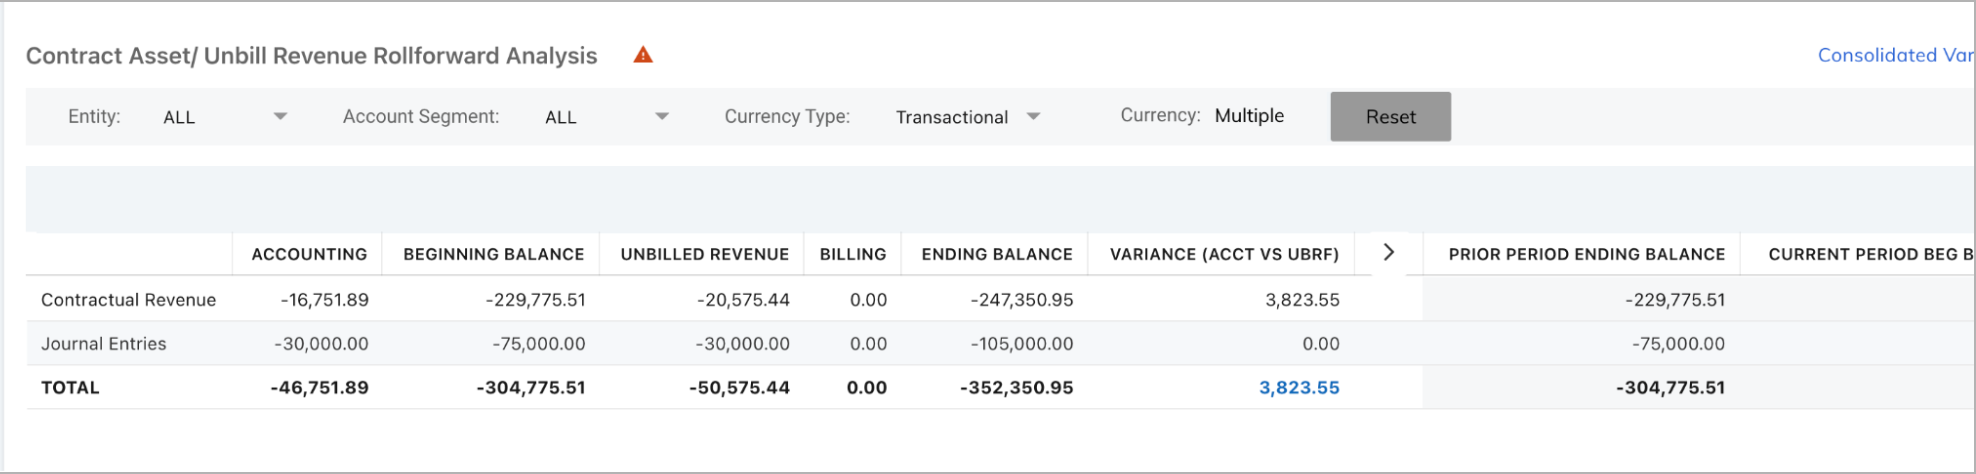
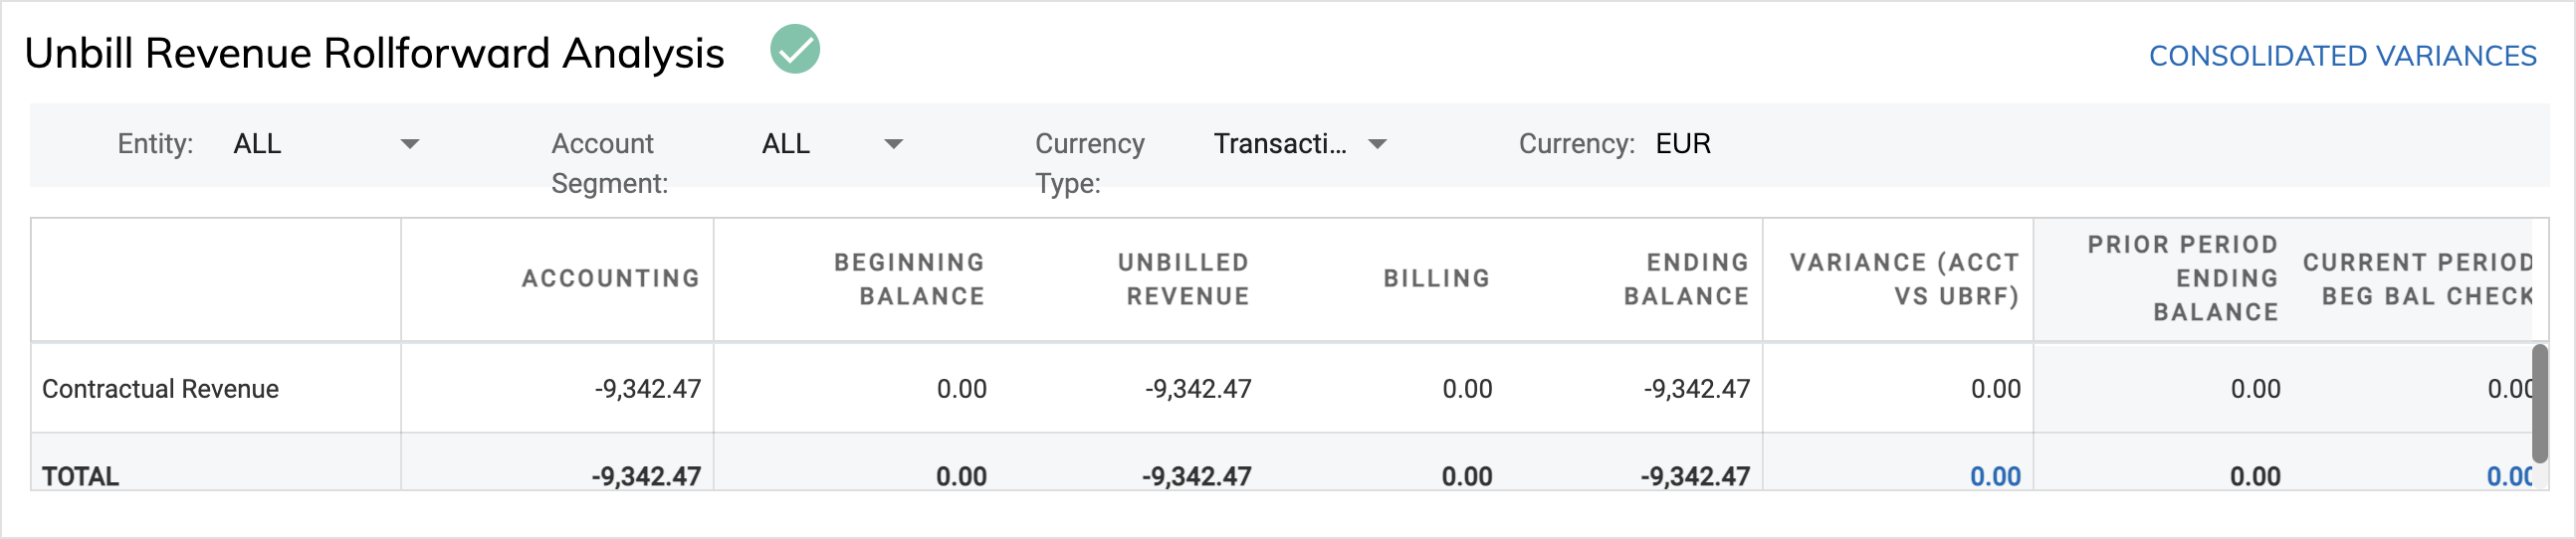
Unbill Revenue Rollforward Analysis
This table represents the summary level of the Unbill RollForward Report for the current period by revenue type. The following reconciliation steps required by the close process are automated to identify any variances:
- Accounting Details Report = Current period activities (Unbilled Revenue + Billing)
- Current Open Period Beginning Balance = Prior Period Ending Balance
The reconciliation result is displayed in the Variance column. If the validation passes, $0 is displayed; otherwise, the variance amount is displayed in the table and an exception flag is displayed next to the table name. When all validations pass, a checkmark is displayed next to the table name.
The data definitions for these reports are explained as follows:
| Report name | Contractual revenue | Journal Entries |
|---|---|---|
| Accounting Detail Report |
The sum of journal entries that were posted and will be posted in the current open period with the following flags:
|
The sum of journal entries that were posted and will be posted in the current open period with the following flags:
|
| Unbill RollForward Report |
For lines with the MJE Flag as N or Null:
|
For lines with the MJE Flag as Y:
|
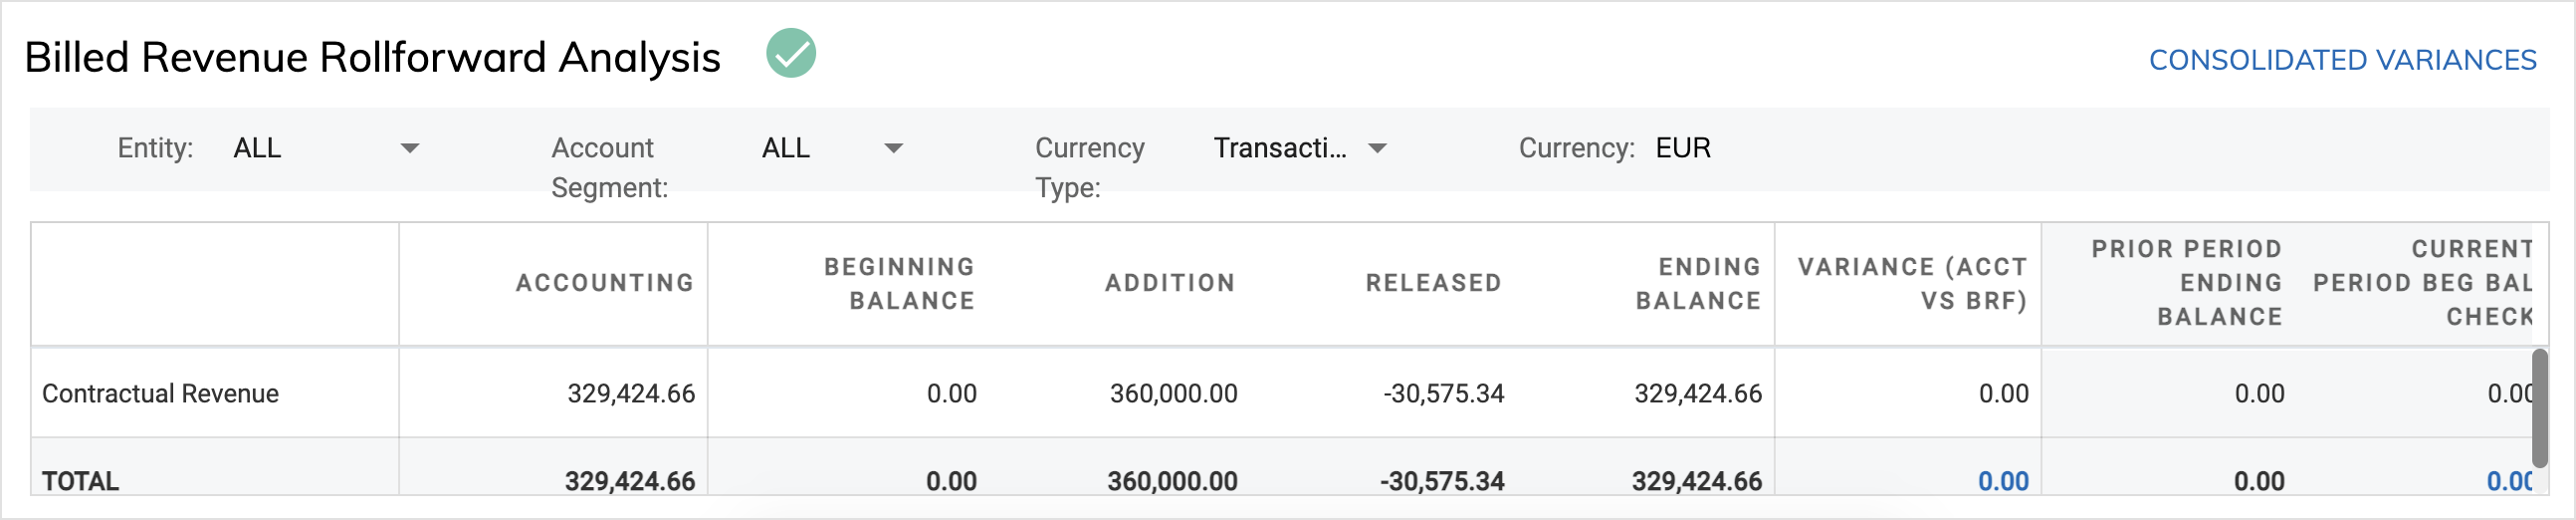
Billed Revenue Rollforward Analysis
This table represents the summary level of the Billing RollForward Report for the current period by revenue type. The following reconciliation steps required by the close process are automated to identify any variances:
- Accounting Details Report = Current period activities (Addition + Released)
- Current Open Period Beginning Balance = Prior Period Ending Balance
The reconciliation result is displayed in the Variance column. If the validation passes, $0 is displayed; otherwise, the variance amount is displayed in the table and an exception flag is displayed next to the table name. When all validations pass, a checkmark is displayed next to the table name.
The data definitions for these reports are explained as follows:
| Report name | Contractual revenue |
|---|---|
| Accounting Detail Report |
The sum of journal entries that were posted and will be posted in the current open period with the following flags:
|
| Billing RollForward Report |
|
Trend Analysis
The Trend Analysis tab provides you with insight into the activities that cause changes to the planned revenue as of the prior period close in Zuora Revenue waterfall. From this tab, you can tell the difference in contractual revenue, adjustment revenue, and total revenue between the planned revenue as of the prior period close and the actual revenue in the current month.
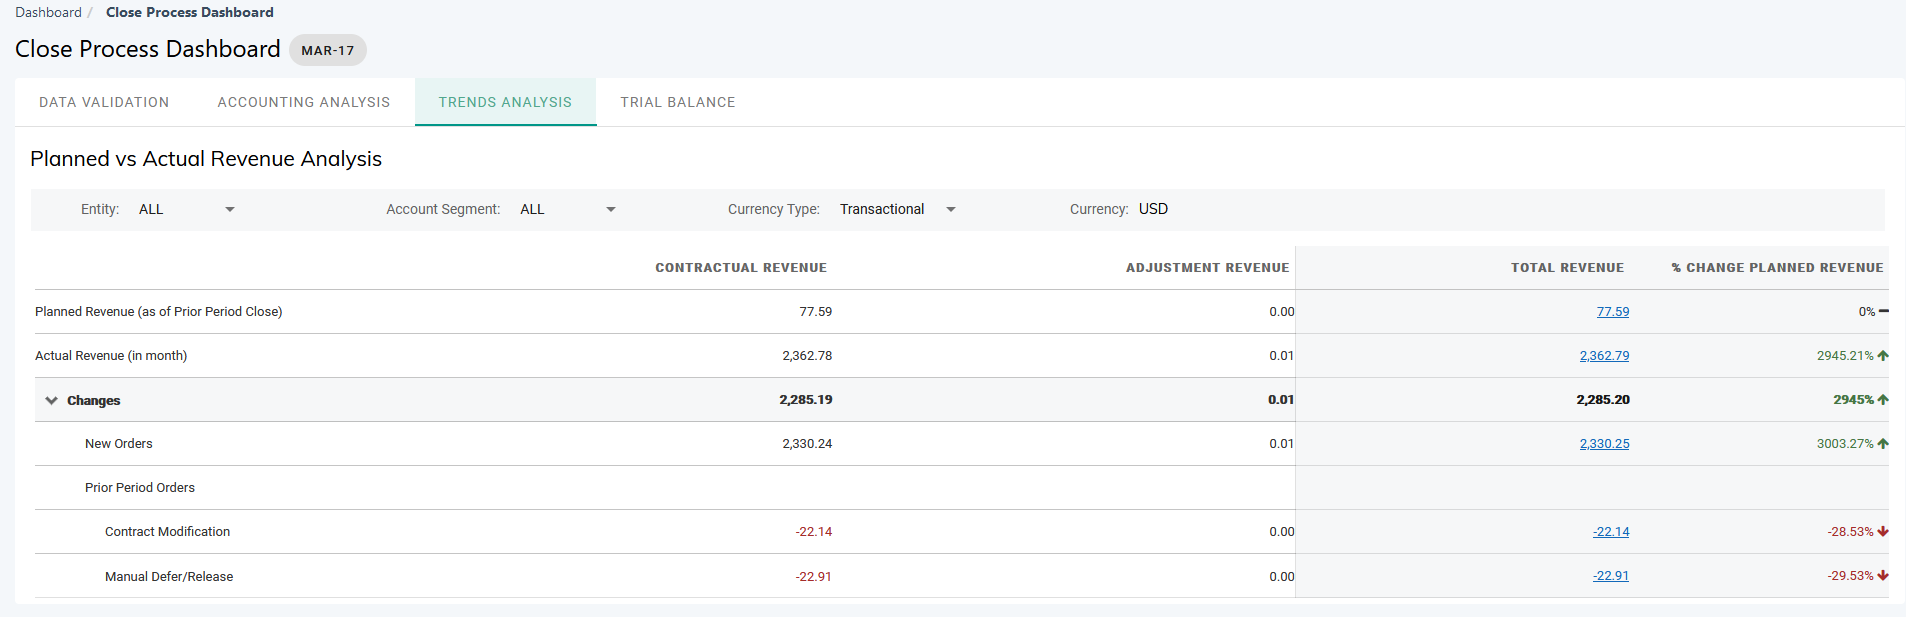
The Contractual Revenue, Adjustment Revenue, and Total Revenue columns in the Planned vs Actual Revenue Analysis table are calculated in the following manner:
- Contractual revenue = Sum of revenue schedules with Schedule Type being R, V, and I
- Adjustment Revenue = Sum of revenue schedules with Schedule Type being A
- Total Revenue = Contractual Revenue + Adjustment Revenue
The difference is calculated by subtracting the planned revenue as of the prior period close from the actual revenue of the current month and displayed on the Changes row. The difference is also displayed as a percentage of actual revenue in the % Change Planned Revenue column.
Changes in revenue for the period are categorized into two types:
- New orders: Revenue from the new sales order (SO) lines that are created in the current period.
- Prior period orders: Variance that is caused by amendments or activities in the current period on sales order lines that are created in the prior periods. Changes from prior period orders are further categorized as listed in the table below.
| Change type | Description |
|---|---|
|
New orders |
Revenue from the new SO lines that are created in the current period. This will be a cumulative amount and will not be further split by change type. |
| Prior period orders | |
|
Performance Obligation Satisfied |
Change in Contractual Revenue that is contributed by additional performance obligations that are satisfied in the current period on SO lines created in prior periods. |
|
Variable considerations (VC) |
Change in VC Revenue that is contributed by a change in VC estimates that are entered in the current period on SO lines created in prior periods. VC revenue schedules are created for the current period. |
|
Contract modifications |
Change in Contractual Revenue because of contract modifications in the current period (contract revision period) on SO lines that were created in prior periods. For example, changes in quantity, terms, or price. |
|
SO update - Initial Contract Period |
Change in Contractual Revenue because of contract modifications in the current period (contract initial period) on SO lines that were created in prior periods. For example, changes in quantity, terms, or price. |
|
Manual deferral/release |
Change in Contractual Revenue in the current period because manual revenue deferral or revenue release happens to the SO lines that were created in prior periods. |
|
Revenue Contracts with Retrospective Allocation |
Cumulative change to Adjustment Revenue in the current period based on the revenue contracts that are in retrospective treatment. |
|
Revenue Contracts with Prospective Allocation |
Cumulative change to Adjustment Revenue in the current period based on the revenue contracts that are in prospective treatment. |
Clicking any change breakdown value in the Total Revenue column opens the Trend Analysis - Details page. This page represents the top 40 contributors by revenue contracts, or SO line IDs to the specific revenue change type that you just click on the Trend Analysis tab. From the Trend Analysis - Details page, you can also link to Revenue Workbench to review a specific revenue contract or export the current data in either summary level or in details level.
In the month when the Trend Analysis tab is initially enabled, it will first display the actual revenue of the current open period for both Actual Revenue and Planned Revenue. There will be no change or variance. After the current period is closed and the next period is opened in Zuora Revenue, this tab will start displaying the actual revenue based on the new open period and planned revenue based on the last closed period.
Trial Balance
The Trial Balance tab provides you with a real-time view of the following general ledger (GL) account activity and balance that is maintained in Zuora Revenue.
- Total account activity for the profit and loss (P&L) accounts
- The account ending balance for the balance sheet (B/S) accounts
Data presented in this tab matches the Trial Balance Report and can be filtered based on entity, account segment, and currency type.
| Column | Description |
|---|---|
|
ACCT NO. |
Displays the account number that represents the natural account segment from the chart of accounts. |
|
ACCT DESCRIPTION |
Displays the account segment type that is configured in Zuora Revenue (Setups > Application > Accounting Setup) |
|
PRIOR PTD |
|
|
PTD |
|
|
QTD |
|
|
YTD |
|
|
PTD $ CHANGE |
Displays the difference between the PTD amount and the Prior PTD amount. The difference is calculated based on the following formula: PTD $ Change = PTD - Prior PTD |
|
PTD % CHANGE |
Displays the PTD $ CHANGE value as a percentage of the Prior PTD amount. The percentage is calculated based on the following formula: PTD % Change = PTD $ Change/Prior PTD*100% |
Bookings & Billings
The Bookings & Billings tab provides the breakdown of bookings data and billings data by data source and transaction type as shown in the following graphic.
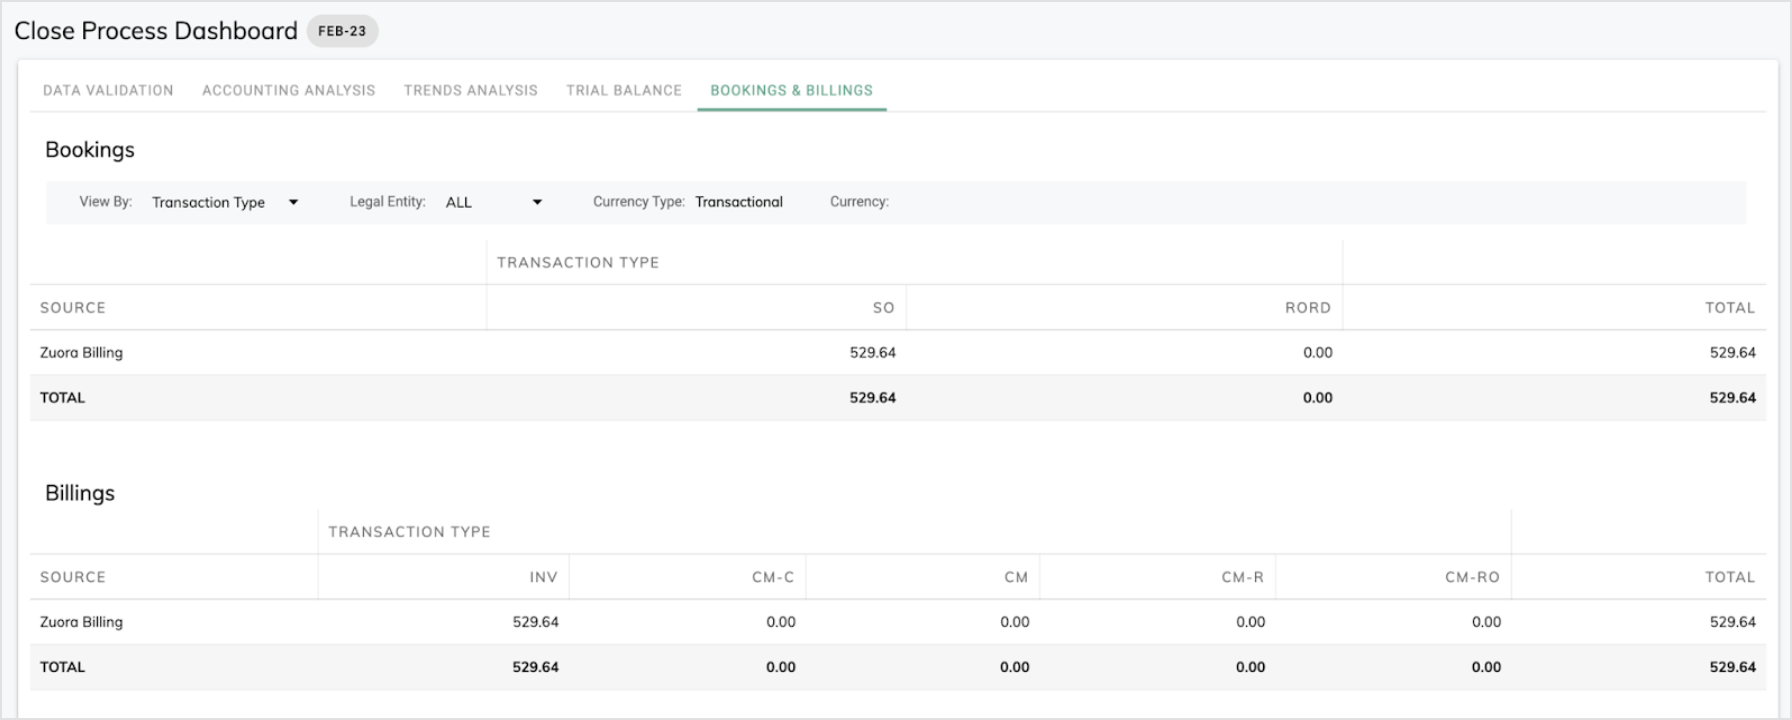
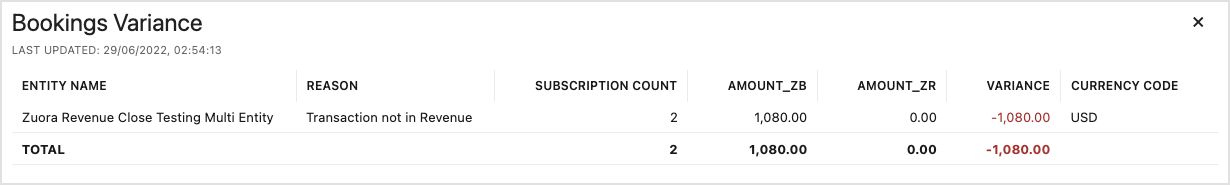
Specifically, when you have Billing - Revenue Integration enabled, if the data source is Zuora Billing in this tab, links are provided in the Variance column to view the data variance summary and details.
- Click Summary to open a popup window that displays the variance in total and the reason causing the variance.
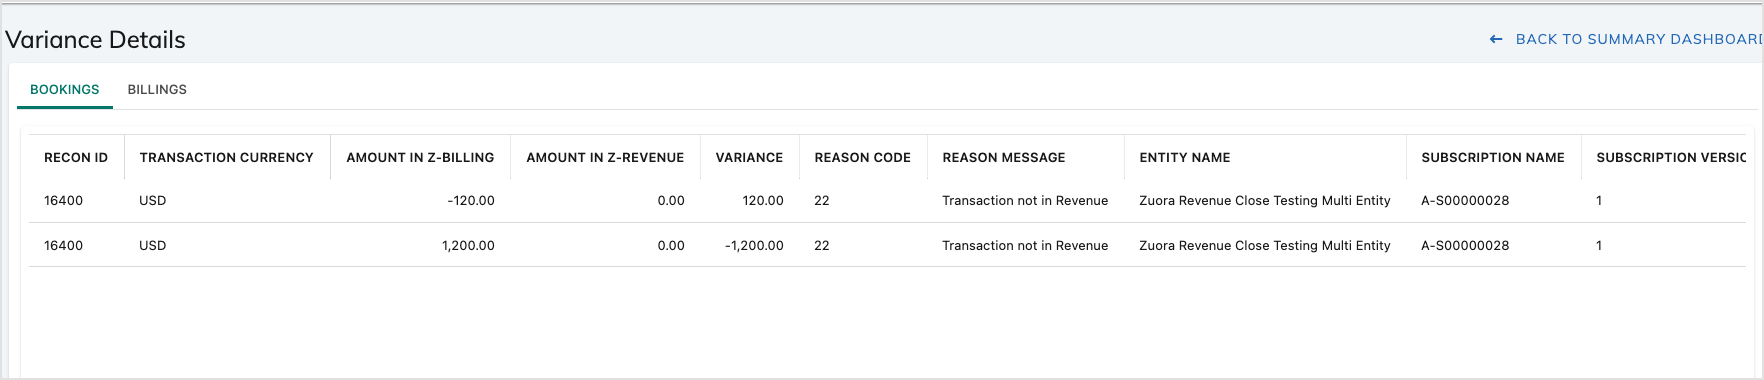
- Click Details to navigate to another UI page with separate tabs displaying the booking data variance and billing data variance in detail, where you can see the subscriptions that cause the variance. See this page for further details
Period Close Tasks
Use this tab as a central point to complete all period-close tasks to close the current and open the next period by organization that is set up in Zuora Revenue. During the period-close phase, the period-close template as configured in Zuora Revenue can be executed from the Close Process dashboard. For step-by-step instructions, see Close current period from Close Process dashboard.