Export the Data
You can export analytics data from any version of your rule as a CSV file.
You can export data for all outcomes across all user types as follows:
- Since the date on which the version was created to the current date
- Between a defined start and end date. To define the start and/or end date, apply a filter as described in the Apply a Filter topic
You can also choose to download the data in the following formats:
- Aggregated data, which means that all data for an output is displayed in a single row
- Data that is broken down by date, which means that the data for an output is displayed in separate rows for the dates on which data is available
Note: If you select daily data, no row is included in the CSV file for days when no end user followed that path in your rule.
Export All Data
To export aggregated analytics data from a version of your feature, complete the following steps:
- Select Products from the main menu
- Select Features from the menu options
- Select the feature for which you want to view analytics data
- Select the version of the feature you require
- Scroll down to the Rules Builder section
- Select the Analytics button
- If required, filter the data as described in the Apply a Filter topic
Note: You can reset the filter before downloading if you do not want to download time-bound data. To do this, select the reset icon (
 ) to the right of the To text box.
 - Select the the download icon to the right of the filter options
If you have not applied a filter, the following options display:
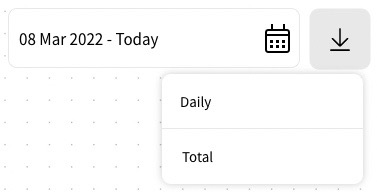
Select Total to download the aggregated data.
If you have applied a filter, the following options display:

Select Total (selected data range) to download the date-bound aggregated data.
The data is downloaded as a CSV file. For further information on the format of the file, see the Understand the Export Data section below.
Export Daily Data
To export daily analytics data from a version of your feature, complete the following steps:
- Select Products from the main menu
- Select Features from the menu options
- Select the feature for which you want to view analytics data
- Select the version of the feature you require
- Scroll down to the Rules Builder section
- Select the Analytics button
- If required, filter the data as described in the Apply a Filter topic
Note: You can reset the filter before downloading if you do not want to download time-bound data. To do this, select the reset icon (
) to the right of the To text box. - Select the the download icon to the right of the filter options
If you have not applied a filter, the following options display:

Select Daily to download the daily data.
If you have applied a filter, the following options display:
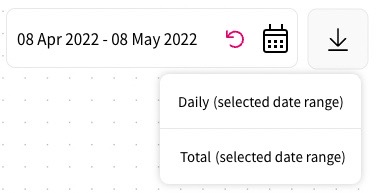
Select Daily (selected data range) to download the date-bound daily data.
The data is downloaded as a CSV file. For further information on the format of the file, see the Understand the Export Data section below.
Understand the Export Data
The name of the exported CSV file has the following format:
<tenant>-<implementation>-<feature>-<version>-<datatype>
For example, given the following:
- Tenant name is Muirton
- Implementation type is HTML
- Feature is called Subscription
- Version is 234
A file containing aggregated data would have the following name:
muirton-html-subscription-234-all-time.csv
A file containing daily data would have the following name:
muirton-html-subscription-234-daily.csv
As you can see from these examples, the <datatype> identifies whether the downloaded data is aggregated or daily.
The columns in the CSV file are as described in the following table:
| Column Heading | Description |
|---|---|
| tab | Identifies the user type canvas that contains the outcome
Can be any of the following:
|
| outcomePath | Identifies the path on the user type canvas that is followed to reach the outcome
For example, the following entry shows a path in a subrule where the user encounters an output named Payment after selecting button 3: SubruleNode,InputNode,DecisionPoint,DecisionPoint,DecisionPoint,SubruleOutputNode: |
| outcomeId | Identifies the outcome to which the data refers by ID
For example, Transformation:Create Account Data Capture Form |
| total | Provides the total number of users that encountered the outcome |
| bucketStart | Only populated if daily data has been exported
If daily data has been exported, identifies the date and time on which the conversion numbers were collected in the format |
| bucketInterval | Only populated if daily data has been exported
If daily data has been exported, identifies the period to which the conversion numbers apply This is always |
| conversion: <type> | Provides the number of end users who converted when they encountered this output
<type> identifies the type of conversion. Some common examples are as follows:
|
You can import the CSV file to an external tool for further analysis.
For example, you could add a percentage column to the sheet in Google Sheets, or add a Pivot table to present the data. For further information on adding percentages to a Google sheet, refer to the Add formulas and functions topic in the Google Docs Editors Help. For further information on adding a pivot table, refer to the Create and edit pivot tables topic in the Google Workspace Learning Center.